Visualization Tools
 The ‘Visualization tools’ are used to view surfaces in different ways. The options available are 3D Viewer, Simulated waterflow, and Wetting front.
 3D Viewer
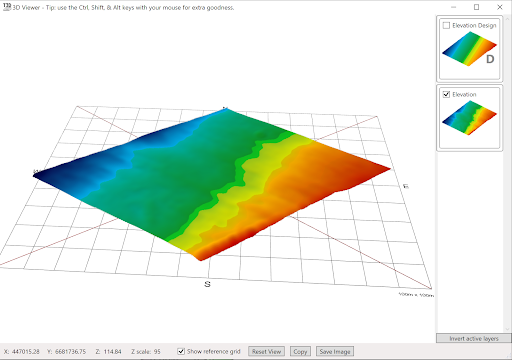 When using the ‘3D viewer’, a window will appear that displays the field as a 3D model (shown below), this view can be controlled with the mouse. All selected surfaces will be displayed
- By left clicking and dragging on the surface the model can be rotated, allowing for viewing from multiple angles.
- The 3D focal point is indicated by the point where all 4 of the red lines meet. These lines can be seen by holding the left mouse button down anywhere on the viewer surface. Holding left-click and moving the mouse will also allow you to change the viewing angle.
- Holding the <Shift> key while left clicking and dragging allows you to shift the focal point of the terrain model. This allows you to rotate around different parts of the model and zooming in on the exact point of interest. Holding down the <Alt> key while left clicking will cause the focal point to shift up or down only.
- Scrolling the mouse wheel will zoom in and out (based on the model’s current focal point).
- Holding the <CTRL> key while scrolling will alter the vertical scale of the terrain model. This controls exaggeration of the surface features and can be helpful to understand small local height differences.
- Overlays can be added to the 3D Viewer by dragging the layer from the surface display on the right of the screen onto the 3D Viewer surface.
How does this tool help?
There are multiple ways in which the 3D viewing tool can be implemented to make design work easier:
- Swapping between surfaces - Multiple surface layers can be added into the 3D viewer. In the main window, activate (tick) just the base and final design surfaces in your project, to show just two surfaces in 3D. Then by turning one off in the 3D viewer and pressing the ‘Invert active layers’ button you are able to switch between them to identify where the biggest changes were made.
- Edge matching regions - Sometimes the design surface is divided into multiple regions to allow custom designs on each part. For example, you may apply Multi-Fit to two sides of a drain. This will often lead to vertical jumps or ‘cliffs’ between regions. The 3D Viewer tool allows for a more detailed view that is updated at the same time as adjustments to the surface are made. This can help you line up the edges of the design.
Adding Overlays to the 3D Viewer
You can drag any number of overlays and guides right onto the 3D Viewer window. This can really help you understand the design. For example, you can add a cut/fill overlay, or a drain line. If you drag in the wrong overlays, click the Clear Overlays button and start again. If you just want to see the overlays, and not the surface elevation-based coloring, check the “Only overlays” box.
 Simulated Surface Flow
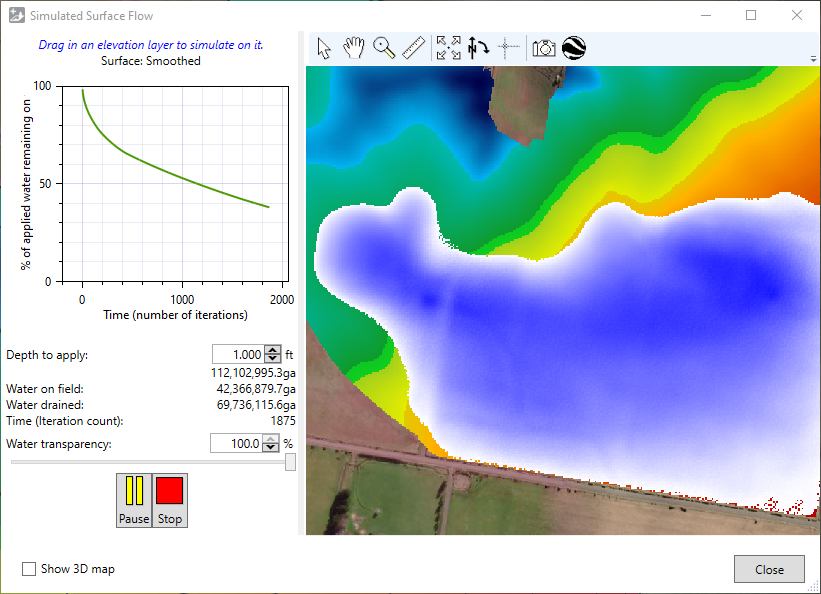 The ‘Simulated Surface Flow’ tool opens a window to display a simulation of water flow across the selected layer. The water simulator helps understand how water will flow, both on an existing field surface, and on a surface with a design applied to it.
- To simulate water on a different elevation surface, drag it from the main window into the surface flow window.
- The graph shows the percentage of water remaining on the field over time. It is not populated until the simulation is started.
- ‘Depth to apply’ is a setting for the amount of water to be applied to the field.
- A larger initial depth of application will cause the field to take longer to drain
- Differences in initial depth may cause different issues to become apparent - for instance a large application may cause banks to overtop and different water flow paths to become apparent.
- ‘Water on field’ displays how much water is currently on the field.
- ‘Water drained’ shows how much water has been drained from.
- ‘Time (iteration count)’ is an indicator of how much time has elapsed since the model started running.
- Click the green play button in the lower left to start the simulation.
Points to consider:
- Time in the simulation is not any set measurement of seconds or minutes. The passage of time is tracked with a counter called ‘iterations’.
- The simulation should only be used as an estimate because the simulation does not take soil qualities into account and treats the surface like a concrete slab.
 Wetting Front
‘Wetting Front’ is a tool that allows you to visualize how a field will react with certain depths of static water on the field.
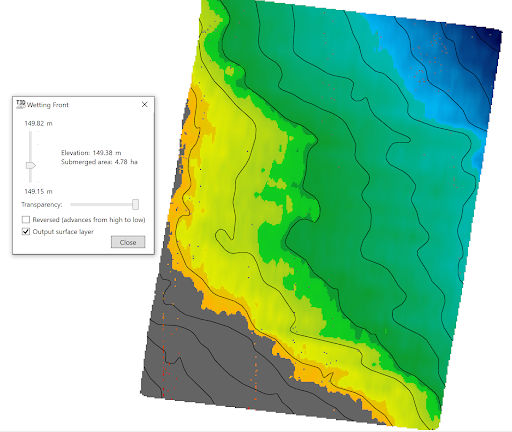 The pop-up window for this tool has 2 sliders that control the water appearance on the field.
- The vertical slider controls depth of water displayed on the field, the sliders minimum and maximum values are based on the elevations of the field.
- Right of the vertical slider is the current ‘Elevation’ , as well as ‘Submerged area’.
- The horizontal slider controls ‘Transparency’, the further to the left that this slider is the fainter the submerged area will appear. If the slider is at its left most position the overlay will not be visible.
There are 2 checkboxes:
- ‘Reversed’ will reverse how the overlay is generated on the field moving from the highest point to the lowest.
- ‘Output surface layer’ will create a surface overlay layer of the submersion data that is being displayed when the tool is closed.