Add contour banks (T3D+)
 This tool is used to add contour banks/terraces. To begin creating a new set of contour banks/terraces click on the ‘Add new contour bank / terrace set’ button in the pop-up window. When creating contour banks/terraces a blue line in the working area is used to control the placement, point A on the line will act as the starting/reference point when generating the design lines.
 The Contour design window can be broken into top and bottom sections:
The Top section
- ‘Contour bank grade (%)’ allows you to control the slope of the contour banks
- ‘Sample Distance (m)’ will control how often T3RRA Design Plus will look at the lines to make sure they are at the desired slope.
- Contour banks/terraces can be set to run to the left, right or both sides of the start line, by selecting the option you would like. The ‘Both’ option is linked to a checkbox allowing you to reverse the grade of the contour banks/terraces.
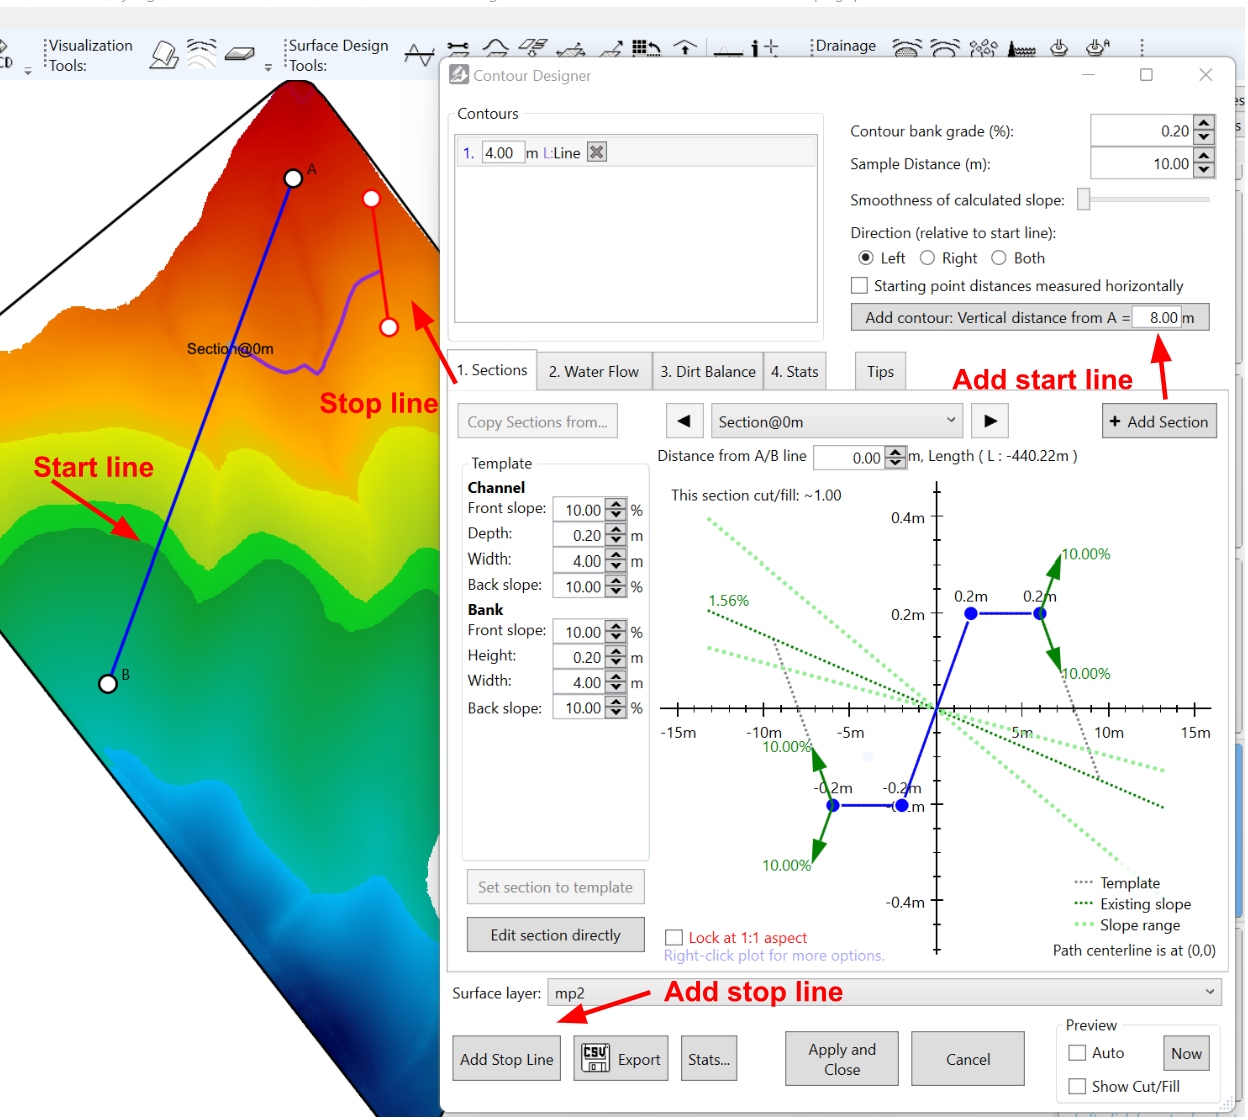
- ‘Add contour: Vertical/Horizontal distance from A = X m’ this button will display a distance from the starting point. If the checkbox for ‘Starting point distances measured horizontally’ is selected this distance will rise by 50 meters horizontally each time the button is pressed and a new line added. If the checkbox is left unselected, the distance will rise by 2 meters vertically each time the button is pressed and a new line added. These distances from the start point can be altered manually by clicking on the distance value where each line appears in the box on the top left hand side and typing in the new value.
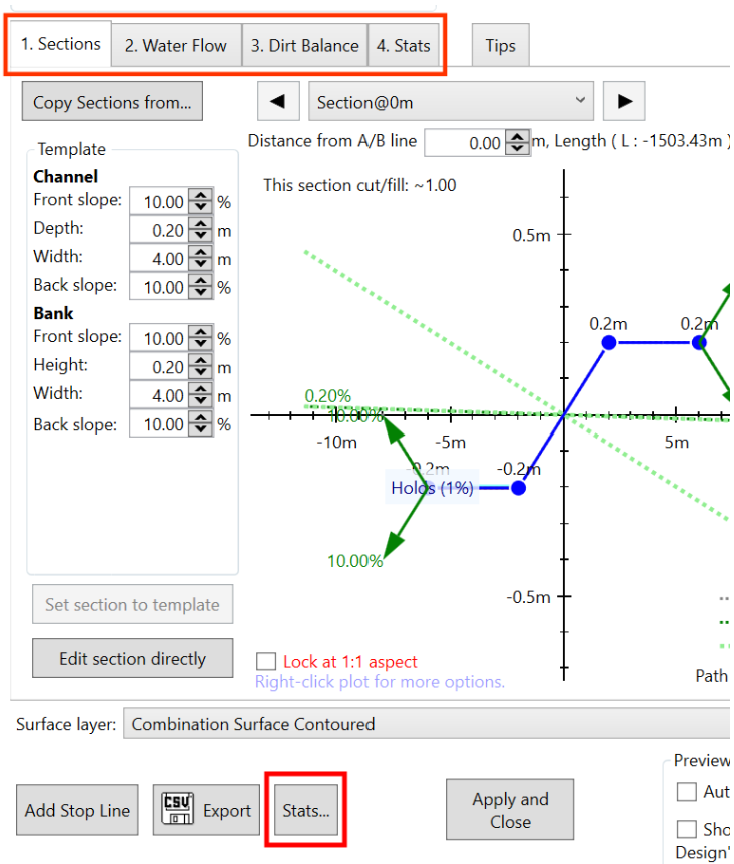
Tab 1: Sections
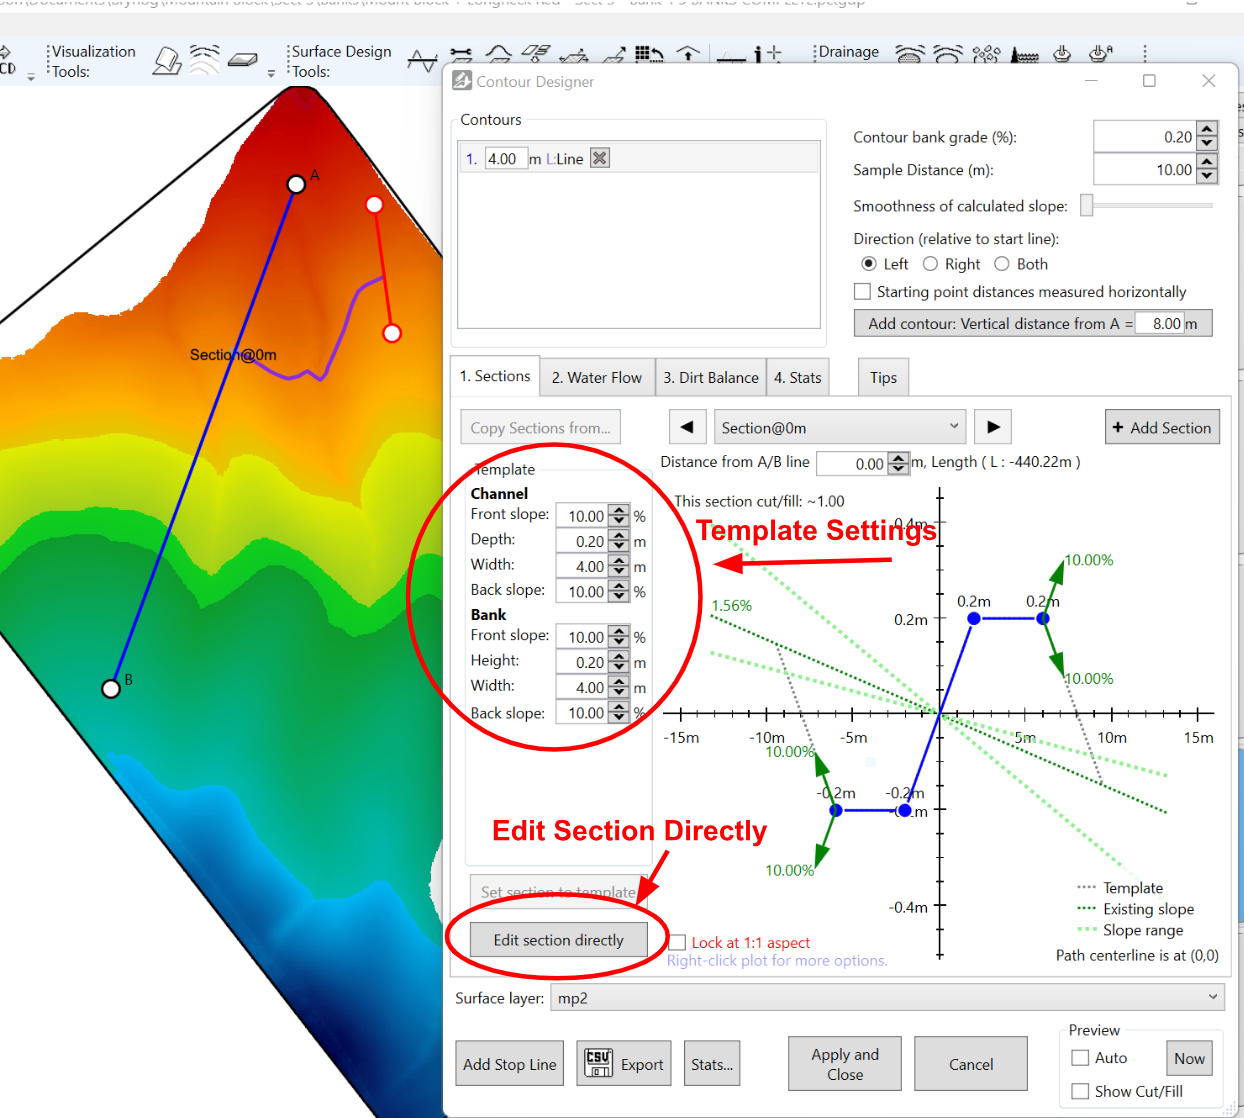
There are many values to tweak on the left in the ‘Template’ section. They are broadly grouped into two sections depending on whether they affect the channel or the bank. Try changing a few values to see how they affect the cross section shown on the right. They include:
- Height and depth. Use these to balance cut and fill while setting your desired total contour height. The capacity of the contour is affected by the sum of these two. A high bank increases capacity, but can lead to water backing up onto the nearby field.
- Width. A wider contour can carry more water without it getting too fast, but this can lead to increased earthworks in steeper areas. Increase width for sections where more water is expected. You can adjust the width of the bank to balance cut and fill.
- Slopes. These control how quickly your contour transitions between the natural surface, the bank, and the channel. Flatter slopes are better for trafficability, but can lead to more earthmoving. Steeper slopes reduce earthmoving, but can cause extra erosion.
Contour cross sections can be highly customized. Just click on the [Edit section directly] button to get started. You can even save your custom cross sections for later reuse. Simply right-click on a clear part of the plot (when editing directly) and click Save. Load, and some other handy tools, are also in the same menu. If you have made a mess (why not try clicking around and editing things for a while) and want to go back to the simpler template based section, just click on [Return to standard controls] in the bottom right, then click on [Set section to template] in the bottom left.
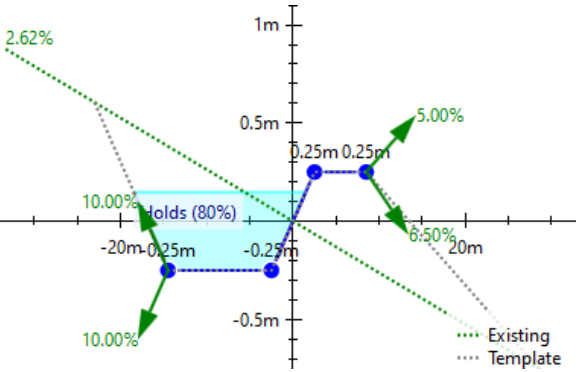
 Cross-Section Diagram Explained:
Here is the excerpt from the above image. This diagram shows the cross section of the contour which has been designed by completing the details to the left.
- Slope Range: shows the range of the prevailing slopes along the contour nearest to this section. Doing this will help you position the contour to minimize the earthworks of the design.
- Existing Slope: The current slope of that cross-section
- Template: The newly designed slope
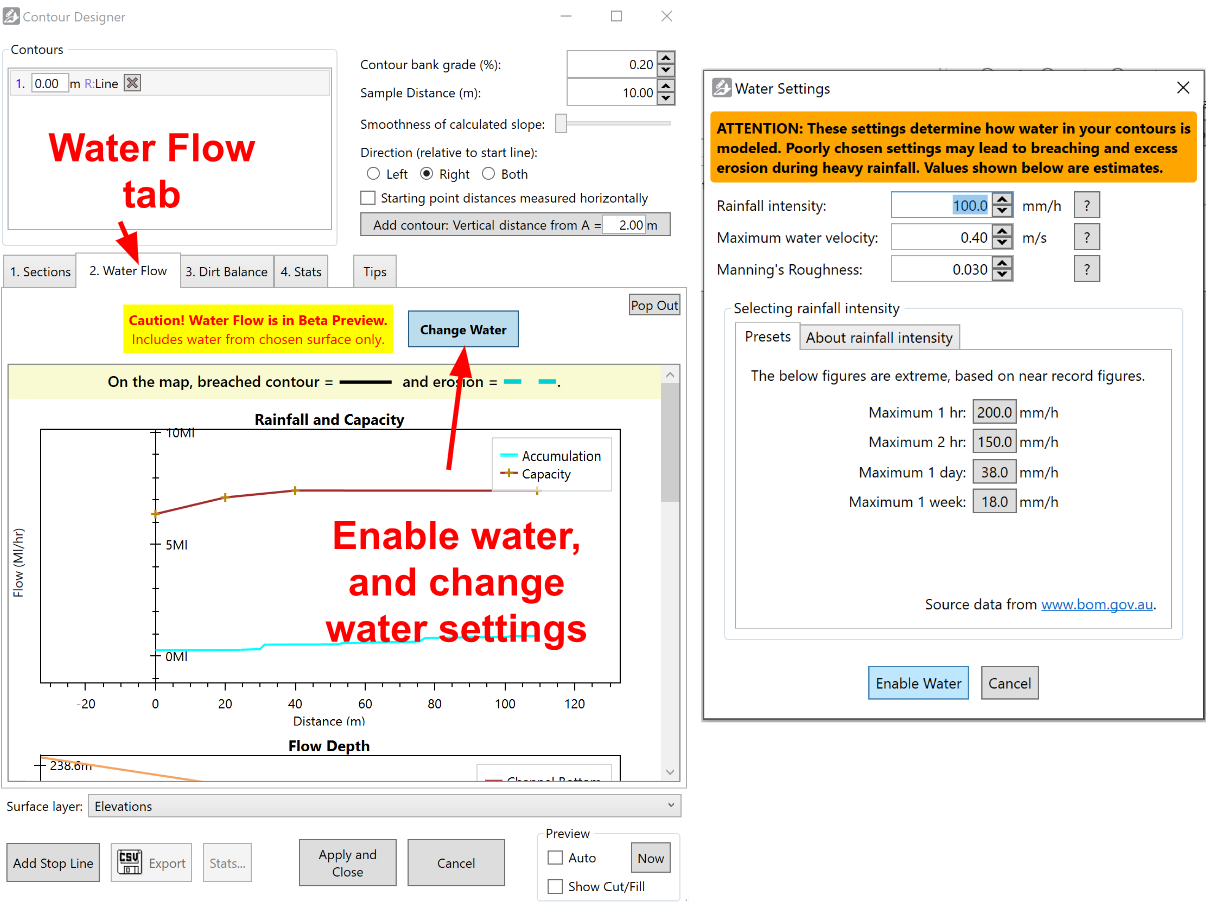
Tab 2: Water Flow
Here you can enable water flow estimates for your contours. This helps you choose an appropriate size for your contours at various points. To start working with water flow in contours, you should start by deciding on a rainfall event, a surface roughness, and maximum desired water flow speed.
 The water flow estimates are just estimates, and can only be as good as your inputs. There are various tips in this section to help you choose conservative values, but we take no responsibility for breached contours - this is just a guide to help with on-site planning and adjustments.
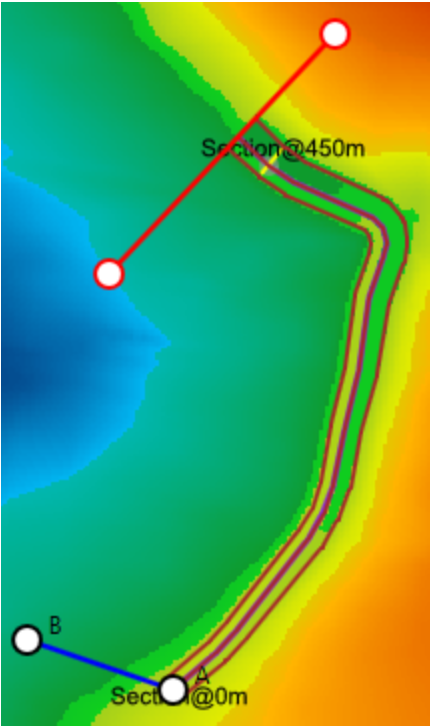
Once water flow is enabled, the designer starts to calculate the accumulated water flow. Once that is complete, a series of water flow plots appear in this tab, and each cross section profile displays the estimated water level. The map and designer will also highlight sections of each contour that may breach or erode (see right).
NOTE: Contour capacity will vary depending on the shape of the contour and the prevailing slope. A contour through very flat country will carry extra water across the uphill slope.
Tab 3: Dirt Balance
This tab displays the dirt balance along the length of the selected contour. This is very helpful for avoiding long-distance movement of dirt. If the dirt balance has been minimized, implementing the design with a bulldozer (or bucket scraper) can be a lot more efficient.
Tab 4: Stats
Various statistics for the current contour are displayed here. For more information, including earthmoving, water flow details (and more), click on the ‘Stats…’ button at the bottom of the window.
Using the Contour tool
With all the functions that we’ve managed to put into the contours tool it can be confusing on where to start. Here is a helpful guide on creating a contour/levee design.
Step 1: Initial setup of paths
Move the pop-up window so you can see the surface. Adjust the start line so that it follows a ridge (ideally with A at the higher end). You can also position the start line going down a valley (if you do, you may want to set a negative contour grade later). Place the Point A at the location you want to start your first contour. Now press the ‘Add contour’ button to add a bank at the start line’s Point A. Then select the contour’s direction, the contour grade, and apply any required path smoothing to remove kinks. Contour direction is relative to the start line, looking from A to B.
To avoid flooding the next field over, put a stop line in the contour’s path so it drains at a planned location.
NOTE: If the banks appear to be on the wrong side of their paths, it may be because the elevations of the A and B ends of the line are misleading. Move A or B till their elevations are the other way around (usually so that A is at a higher elevation than B).
Step 2: Refine your contour with water flow
Once you are satisfied with the contour’s location, refine your contour’s shape with the template settings in the Sections tab. Pressing the ‘Edit section directly’ button gives you full control over the cross section:
Making a contour the same size along the whole length works, but involves moving a lot of dirt. A 2/3rds reduction in dirt volume can be achieved by matching the bank capacity to the actual water volume predicted at each point along the bank. To taper the contour, add multiple sections with the ‘Add Section’ button and position them by editing the ‘Distance from A/B line’ field. You can now smoothly vary the size and shape of the contour:

To help guide your adjustments, turn on water estimates with the ‘Enable water’ button. Enter details for a heavy rainfall event and some soil settings in the window that appears:
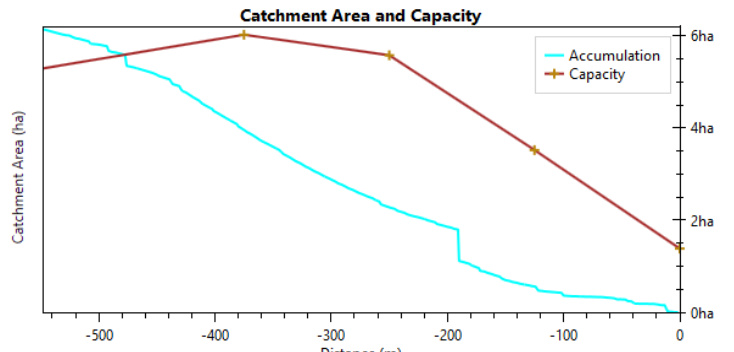
Once calculations are complete, the ‘Water Flow’ tab will display all the water estimates. That includes estimated water depth, water flow speed, and contour capacity (in terms of flow rate and catchment area). The estimated water depth is also shown in each cross section:
When editing your contour, it can be helpful to view the water plots at the same time as you edit cross sections. To do so, click the “Pop out” button in the top right under the water flow tab. The water plots will update as you make changes to each section.
While you are working on the water flow, remember that you can stop a contour from breaching by increasing channel capacity or by increasing the grade (moving the water faster). If you do this, ensure you don’t risk eroding the contour channel. 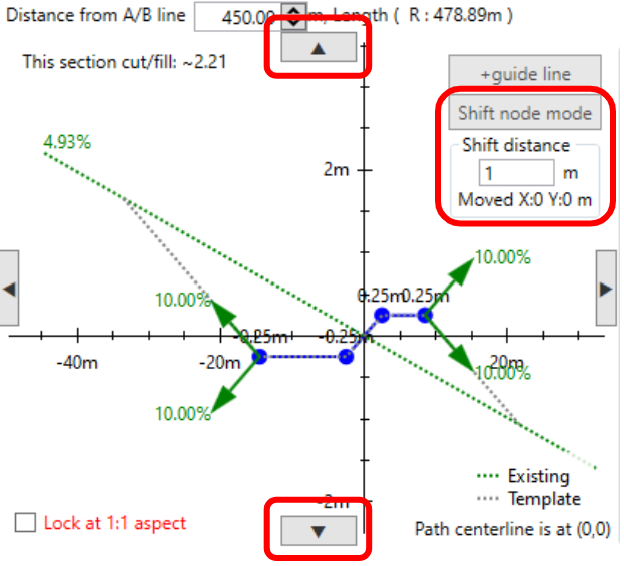 You can increase the grade for the whole contour or for one section at a time. To change the grade for one part of a contour, move sections vertically. Do this by ‘editing the section directly’ and entering “Shift node mode” (see right). You may have to move the rest of the sections up or down to match so that they continue to drain appropriately. When doing this, it is helpful to pop out the water depth plot and view the longitudinal profile at the same time.
Conversely, to reduce channel erosion, you can widen your contour channel or decrease contour grade. Bank design must balance the competing need to slow water down (reducing channel erosion) and to move adequate volumes of water (to avoid over-topping).
If you will be farming over (and in) your contours, check the water flows you expect with and without standing crops. Vegetation can slow down water flow quite a bit, leading to contour breaches.
Step 3: Save on earthmoving
When you are implementing your design, you don’t want to move dirt over long distances. This is especially true for bulldozers, where it would take a lot of effort to move dirt from one end of the contour to the other. Dirt imbalance at a location along the bank occurs because grade and path smoothness considerations result in the channel being too shallow to provide enough dirt for the bank, or so deep that there is no close location to put the dirt. It can also occur in curved sections of the bank where the length of the channel does not match the length of the bank. To manage this, go to the ‘Dirt Balance’ tab and press the ‘Preview pre-balance cut/fill’ button. This shows where there is unbalanced cut (red) and fill (green). While mousing over the graph, a marker appears on the map to show its location.
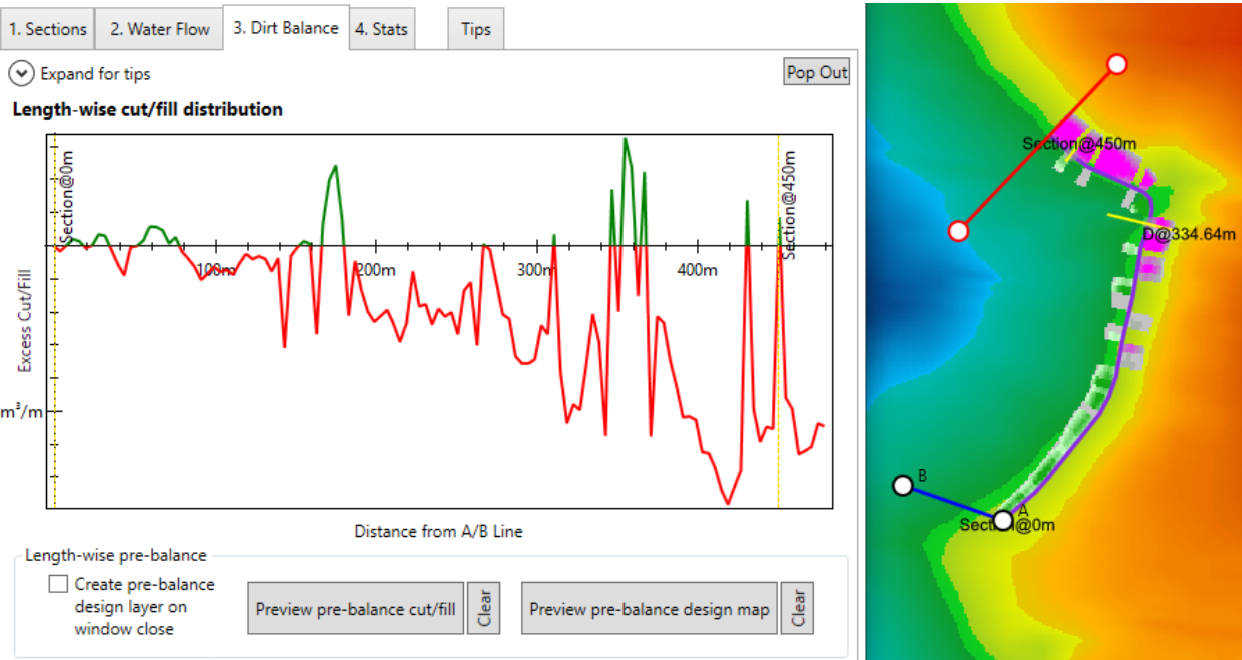
It can be very helpful to pop out the dirt balance graph while you adjust the sections individually. If you do, ensure you have Auto-preview checked. To fix this without ruining water flow, only edit the cross sections by moving them left or right. The example above shows excessive cuts at the north end (at the right end of the graph), so the section at that end should be moved out of the hill (to the right in the section plot below). You can easily move a section left/right by ‘editing the section directly’ and entering “Shift node mode”:

Step 4: Guide with guidelines
 To help make implementing easier, guidelines are your friend. These can be exported as tractor auto-steer paths. Well placed guidelines can make the finishing pass with a bucket scraper very clean. To output guidelines, add guideline markers to each section by editing the section directly. The ‘add guideline’ button is just above the “Shift node mode” button. If the number of guidelines on two neighboring sections matches, the guidelines will join up with a smooth transition (see right). If you’re using a bulldozer and want cross contour guidelines, let us know and we’ll get onto it!
Step 5: Implement!
When you are satisfied with the design, press the ‘Apply and Close’ button at the bottom of the window to output the design and create contour guidance lines. Export the original and design surfaces with any desired guidelines to the format of your choice.
NOTE: If needed, all banks and drains can now be edited after ‘Apply and Close’ has been selected. Simply highlight the necessary tile (right hand side) in the Guides tab and then select . This will reopen the Contour Designer window.
Stats of the Design
 Prior to implementing your contour design, you may want to look at the various stats of the design. When using the Contour Tool, there are four tabs at the top of this screen (Sections, Water Flow, Dirt Balance, Stats). All four tabs help create an optimal contour design. There are more stats which can be accessed for the design.
Select the Stats button at the bottom of the Contour Designer window. This will open a new window called ‘Contour Info’:
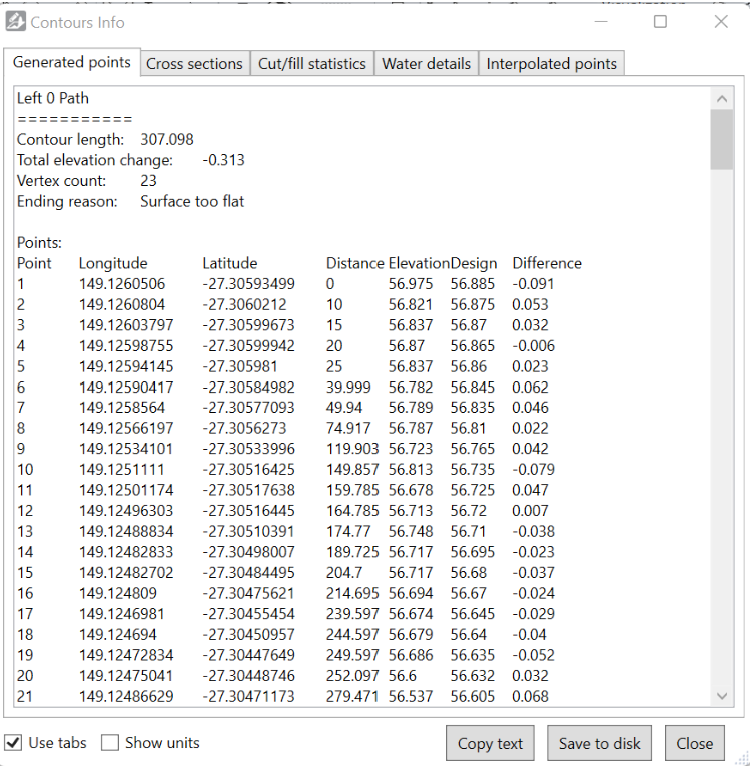 The Contour Info window displays very detailed information about your current design, as well as allowing you to export this data (using Copy text or Save to disk options at the bottom).
There are five tabs of data available:
- Generated points
- Cross sections
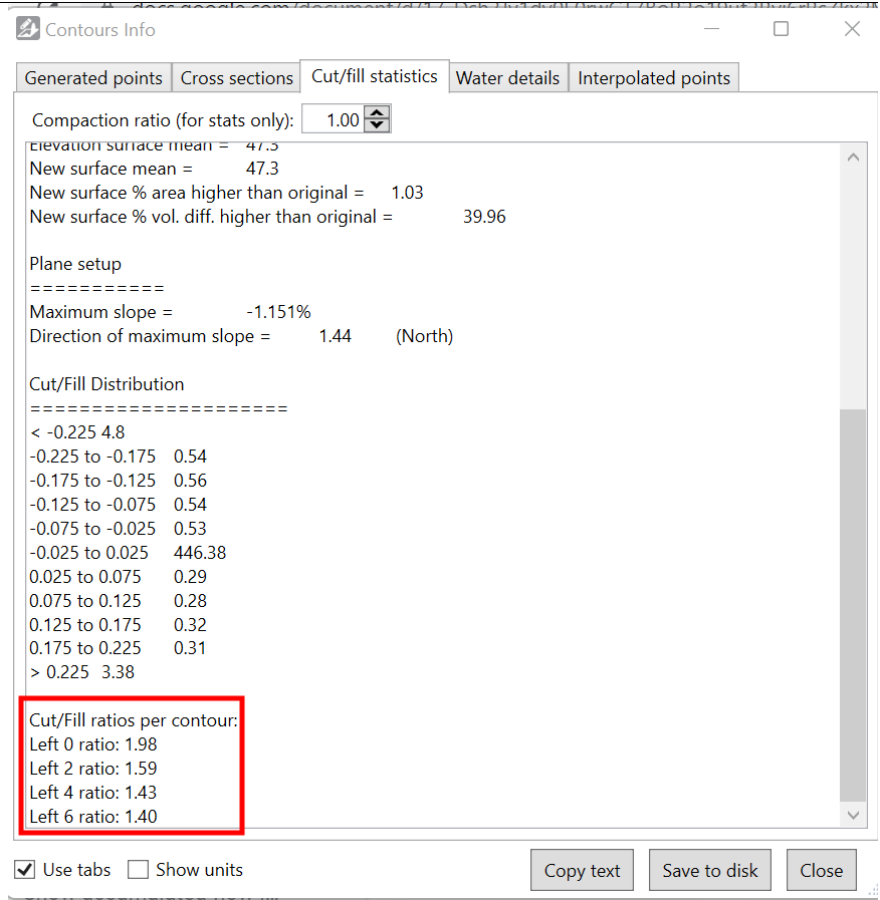
- Cut/fill statistics
- Water details
- Interpolated points
 The information contained in these tabs is designed to provide everything you need to create your own reports and summaries in other programs, such as Excel.
NOTE: By selecting the Cut/fill statistics tab, you are able to check the cut/fill volume for each contour bank within the design. Simply scroll down to the bottom in the parentheses.