Show directional slope
 ‘Show Directional slope’ allows you to visualize the severity of slopes going in a set direction. The severity of the slope is represented by color with Red showing a low severity of slope and dark Blue showing a high severity of the slope in that direction.
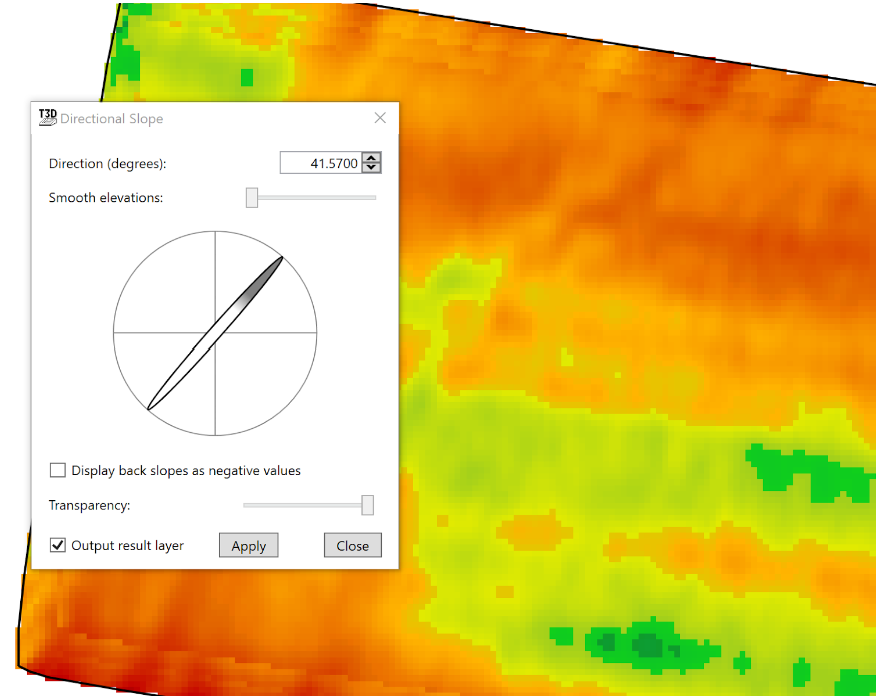
- ‘Direction (degrees)’, this setting allows you to set the directional slope you would like to see on the field. This is the manual direction setting which can be used if you know exactly which direction you wish to view.
- ‘Smooth elevation’ This slider manipulates the peaks and valleys in the present data by taking averages of the data around each point. The further to the right the slider is the more data is averaged resulting in fewer peaks and valleys present in the field.
- The compass. The dark end of the compass needle represents the current directional heading you have set. To adjust the compass click and hold on the needle and rotate it to the direction you wish to display the slopes of.
- ‘Display back slopes as negative values’. This checkbox will display the slopes going in the opposite direction to the compass as a negative value, causing the field to appear vastly different.
- ‘Transparency’. This slider will change how visible the directional slope information is on the surface of the design.
- ‘Output result layer’ tells the system to create a surface layer when the pop-up window is closed.
- ‘Apply’. This button needs to be pressed each time you want to apply a new direction to the field.
- ‘Close’, this button will close the pop-up window and create a surface layer if the ‘Output result layer’ checkbox has been selected.