Show Depressions

This tool displays all depressions in the visible surfaces. The overlay layer shows the depth of the depression with a white to blue scale, starting at white for zero depth, going to deep blue at maximum depth.
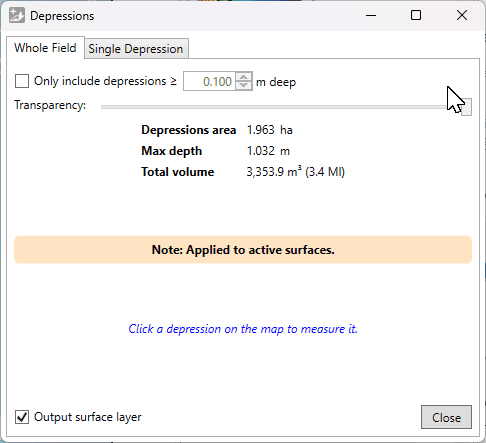
Tab: Whole Field
- '☐ Only include depressions ≥ (X)m' allows you to filter out shallow depressions.
- 'Transparency' is a slider which adjusts how clearly the depressions will be displayed in the working area. With this, you can easily check the elevation surface underneath.
- '☐ Output surface layer' controls whether the shown overlay layer will be retained when you click ‘Close’. If you are just checking their locations or volumes, you can untick it.
Statistics about the depressions found are displayed.
Tab: Single Depression
Clicking on a depression with this window open (from either tab) will switch to show this tab and show an outline on the map around the selected depression. This tab displays statistics about the selected depression: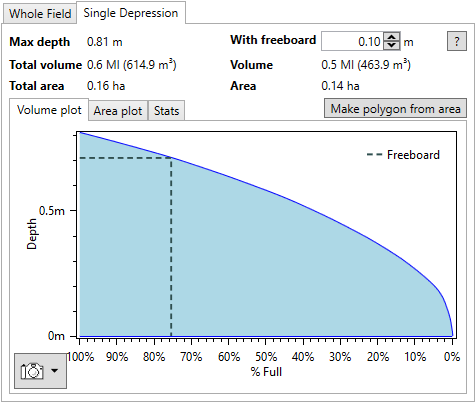
- 'Max depth' This is the maximum depth of the selected depression.
- 'Total volume' This is the total volume of the selected depression, in your selected water and dirt volume units.
- 'Total area' This is the total area of the selected depression.
- 'With freeboard' Freeboard is how far down the desired maximum water level is from the highest possible water level. For dams, this is usually chosen to reduce the risk of erosion leading to a breach or washout.
- 'Volume' This is the volume in the depression below the freeboard level. As freeboard increases, this will decrease.
- 'Area' This is the area of the depression at the chosen freeboard level. As freeboard increases, this will decrease.
- 'Make polygon from area' Click this to create a polygon from the outline on the map.
Further to the above statistics, detailed plots are available for more detailed analysis.
- 'Volume plot' The volume of the depression as a percentage of the total volume as it varies with depth is shown. The position of freeboard is indicated with a dashed line on the plot.
- 'Area plot' The area of the depression as a percentage of the total area as it varies with depth is shown. The position of freeboard is indicated with a dashed line on the plot.
- 'Stats' This sub-tab contains the information displayed in the volume and area plots. Click 'Copy Stats To Clipboard' copy it as text to the clipboard. The 'Separator' option allows changing the separator between values in the text. For copying to a spreadsheet, Tab is recommended.
The plots have a snapshot button in the lower left. Click it to see options to copy to clipboard or save to disk. You can also zoom in and on the plots using the mouse. Try scrolling on the main area or axes, dragging the mouse with different buttons held down, and remember that you can reset the view with double-middle-click.