Surface Derivatives
- Show Depressions
- Show directional depressions
- Show watershed
- Show accumulated flow layer
- Show wetness index
- Show aspect
- Show slope
- Show directional slope
- Show landscape change
Show Depressions

This tool displays all depressions in the visible surfaces. The overlay layer shows the depth of the depression with a white to blue scale, starting at white for zero depth, going to deep blue at maximum depth.
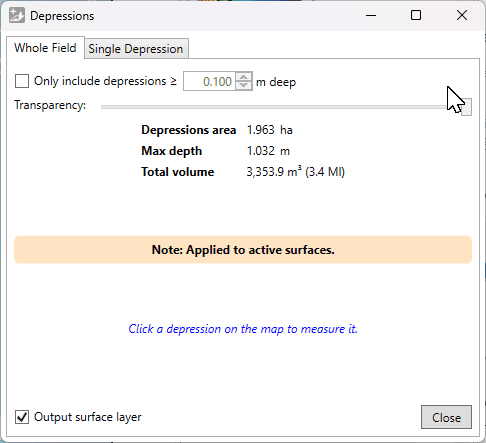
Tab: Whole Field
- '☐ Only include depressions ≥ (X)m' allows you to filter out shallow depressions.
- 'Transparency' is a slider which adjusts how clearly the depressions will be displayed in the working area. With this, you can easily check the elevation surface underneath.
- '☐ Output surface layer' controls whether the shown overlay layer will be retained when you click ‘Close’. If you are just checking their locations or volumes, you can untick it.
Statistics about the depressions found are displayed.
Tab: Single Depression
Clicking on a depression with this window open (from either tab) will switch to show this tab and show an outline on the map around the selected depression. This tab displays statistics about the selected depression: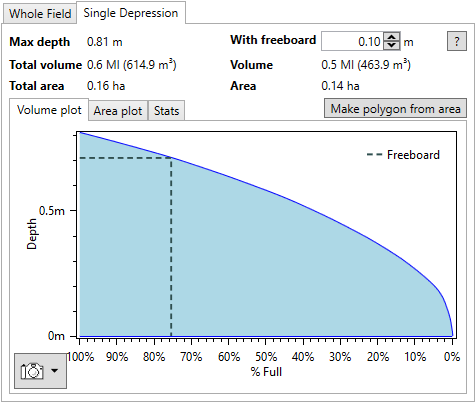
Left side:
- 'Max depth' This is the maximum depth of the selected depression.
- 'Total volume' This is the total volume of the selected depression, in your selected water and dirt volume units.
- 'Total area' This is the total area of the selected depression.
Right side:
- 'With freeboard' Freeboard is how far down the desired maximum water level is from the highest possible water level. For dams, this is usually chosen to reduce the risk of erosion leading to a breach or washout.
- 'Volume' This is the volume in the depression below the freeboard level. As freeboard increases, this will decrease.
- 'Area' This is the area of the depression at the chosen freeboard level. As freeboard increases, this will decrease.
- 'Make polygon from area' Click this to create a polygon from the outline on the map.
Further to the above statistics, detailed plots are available for more detailed analysis.
- 'Volume plot' The volume of the depression as a percentage of the total volume as it varies with depth is shown. The position of freeboard is indicated with a dashed line on the plot.
- 'Area plot' The area of the depression as a percentage of the total area as it varies with depth is shown. The position of freeboard is indicated with a dashed line on the plot.
- 'Stats' This sub-tab contains the information displayed in the volume and area plots. Click 'Copy Stats To Clipboard' copy it as text to the clipboard. The 'Separator' option allows changing the separator between values in the text. For copying to a spreadsheet, Tab is recommended.
The plots have a snapshot button in the lower left. Click it to see options to copy to clipboard or save to disk. You can also zoom in and on the plots using the mouse. Try scrolling on the main area or axes, dragging the mouse with different buttons held down, and remember that you can reset the view with double-middle-click.
Show directional depressions
 ‘Show directional depression’ allows you to select a direction and display any depressions that would affect water flow in that specific direction that would otherwise not.
 ‘Direction (degrees)’ this setting will rotate the simulated water flow direction to help isolate depressions that would affect the water flow.
- ‘Plane strip width’ this tool performs its calculations in strips following the set direction, small strip sizes allow for a more detailed result but it takes longer to process.
- The Compass is a visual method for controlling the direction that is used to calculate depressions.
- ‘Depressions deemed negative’ checking this option will tell the tool to display depressions as red on the surface.
- ‘Transparency’ controls how visible this information will be.
- ‘Output result layer’ will create an output layer upon closing the tool.
- ‘Apply’ this button must be pressed each time a change is made in order for it to be correctly displayed.
Show watershed
 ‘Show watersheds’ identifies the areas of the surface that will flow together to the same exit point on a field. The working area will display the surface in a patchwork of colors, these indicate your watersheds and what will flow out where, the specific colors do not matter, they
  are only to help identify individual watersheds.
- ‘Elevation smoothing’ provides control to adjust the level of detail on the surface
- ‘Segmentation method’ will select a general water event to display watersheds. The options are:
- Hybrid - Immersion and Rainfall event happening simultaneously
- Immersion - submersion of the surface by water as it engulfs the area as in a flooding event
- Rainfall- a fall or shower of rain
- ‘Output watersheds layer’ will create a new design layer when the tool is closed.
Show accumulated flow layer
 The accumulated flow layer shows paths where the water is most likely to pass through. It is recommended that before using the ‘Show accumulated flow’ tool that the ‘Breach depressions’ tool is used for the most accurate water flow results.
 ‘Min. drainage area’ adjusts what the minimum drainage area needs to be before the paths will appear on the surface. The further to the left that the slider is the lower the amount of water that needs to pass through that area to appear on the field in the working area.
- ‘Transparency’ controls how the flow is displayed.
- ‘Output surface layer’ this will tell T3RRA Design Plus to create a design layer upon closing the tool.
- ‘Output flow paths’ which will create guidelines for the flow paths upon closing the tool.
Show wetness index
 ‘Show Wetness index’ also referred to as the Hillslope Wetness Index. This tool creates a grayscale layer of the surface that uses high contrast to show the most affected areas. Darker areas on the field represent where the most water flow is, while lighter areas show where there is little water flow or where the water moves away from.
- ‘Elevation smoothing’ slider that averages out the information on the field reducing or increasing the number of peaks and valleys.
- ‘Transparency’ will change how visible the wetness index is.
- ‘Output result layer’ will create a design layer upon closing the tool.

Show aspect
 Showing aspect will change the surface to a gray-scale to highlight where the sun is hitting the surface. North facing areas will be lighter while south facing areas will be a darker gray.
- ‘Elevation smoothing’ slider that averages out the information on the field reducing or increasing the number of peaks and valleys.
- ‘Transparency’ controls how visible the layer is.
- ‘Output result layer’ will create an output layer upon closing the tool.

Show slope
 ‘Show Slope’ shows the severity of the slopes in the field in a color grade. The color grade used is: Red shows low severity of slope and Dark Blue areas show a high severity of slope.
- ‘Elevation smoothing’ averages the information to grade how severe the slope is. The right end of the slider is the larger area averaged of the elevation points. The left side of the slider shifts the averaging to its smallest radius, resulting in slope severity to be more precise in which areas it reads.
- ‘Transparency’ which controls how visible the layer is.
- ‘Output result layer’ will create a new output surface upon closing the tool.

Show directional slope
 ‘Show Directional slope’ allows you to visualize the severity of slopes going in a set direction. The severity of the slope is represented by color with Red showing a low severity of slope and dark Blue showing a high severity of the slope in that direction.
- ‘Direction (degrees)’, this setting allows you to set the directional slope you would like to see on the field. This is the manual direction setting which can be used if you know exactly which direction you wish to view.
- ‘Smooth elevation’ This slider manipulates the peaks and valleys in the present data by taking averages of the data around each point. The further to the right the slider is the more data is averaged resulting in fewer peaks and valleys present in the field.
- The compass. The dark end of the compass needle represents the current directional heading you have set. To adjust the compass click and hold on the needle and rotate it to the direction you wish to display the slopes of.
- ‘Display back slopes as negative values’. This checkbox will display the slopes going in the opposite direction to the compass as a negative value, causing the field to appear vastly different.
- ‘Transparency’. This slider will change how visible the directional slope information is on the surface of the design.
- ‘Output result layer’ tells the system to create a surface layer when the pop-up window is closed.
- ‘Apply’. This button needs to be pressed each time you want to apply a new direction to the field.
- ‘Close’, this button will close the pop-up window and create a surface layer if the ‘Output result layer’ checkbox has been selected.

Show landscape change
 Landscape change is a large-scale smoothing operation for finding generalized high points.
- ‘Radius for gross landscape smooth operation’ this slider changes the radius for how far the system will look around each point to find the average height to be displayed.
- ‘Consider values higher than the average surface to be positive’ this option controls the color scheme of the display. If left unchecked, high points will be coloured red and low points will be dark blue and vice versa if the option is checked.
- ‘Perform exhaustive averaging (slow, but accurate)’ This slows down the averaging process but more closely analyses the information for more accurate adjustments.
- ‘Transparency’ controls how visible the changes of the tool are.
- ‘Output surface layer’ will create a surface layer upon closing the tool.
