T3RRA Cutta Desktop Manual
How to use T3RRA Cutta Desktop, our field analysis and design tool that has a similar look and feel to our in-cab products.
- Setting up T3RRA Cutta Desktop
- Updating T3RRA Software
- How do you know an update is available?
- How do you update?
- When should you update?
- What should you do if updating causes more problems than it fixes?
- The Main Pages
- Common tools found in the Wizard
- Zoom Control
- Image Overlays
- Choose Mode - 2D or 3D
- View
- Markers
- Screenshot
- Battery Level
- Google Earth
- Surfacing
- Setting the Search Radius manually
- Inline Offsets
- Surfacing a survey also creates a design
- Editing Survey Points
- Common Design Tools
- Full Field Design tools
- Design Functions
- AB Profile Tool
- Best-fit Design
- Multi-fit Design
- Smooth Design
- Regular Smoothing
- Directional Smoothing
- Region Blending
- Offset Design
- Drain Design Tools
- Terrace Design
- Levee Design
- Analysis Tools
- Completing Your Design
- Exporting Data
Setting up T3RRA Cutta Desktop
Hardware
Choosing a PC to run T3RRA software
Requirements:
- Windows 11 (64 bit)
Recommended:
- Intel i5 or better processor, manufactured in 2021 or newer.
- At least 8GB RAM; more RAM facilitates larger fields.
- At least 256GB HDD.
- Integrated or better graphics card.
Perform Windows updates whenever you encounter an error or download a new version of T3RRA software. We suggest updating and testing the software before the earthmoving season each year.
Remember to update T3RRA software after installation. As best practice, regularly connect your PC to the internet at home or in the office, allowing enough time for software updates to complete and install successfully. After completing your earthmoving jobs, update T3RRA software: open the ‘Settings’ window, choose the ‘Application’ tab, then click ‘Download Updates’.
If you use antivirus software, add an exclusion for the T3RRA Cutta folder for your username to help T3RRA Cutta run without interference. For more information, see T3RRA software will not install in Troubleshooting.
T3RRA software runs on any 64bit Windows 11 PC: desktop, laptop or tablet. It works with a regular mouse and keyboard.
Carefully consider how a hardware failure and the time spent waiting for a replacement would affect your operation. If the potential losses from PC failure are high, do not consider a consumer grade PC, or at the very least have a backup option that can be implemented quickly.
Modern PCs can run many different software applications and serve many roles. Consider the impact of using your PC for other activities: some programs and activities consume disk and processor resources, which may make T3RRA software run sluggishly. Avoid activities that cause this resource contention.
NOTE: Maintaining your PC is extremely important. Perform both Windows updates and T3RRA updates at regular intervals.
Installing T3RRA Cutta Desktop Software

Before installation, ensure that you have a good internet connection and that your computer has the latest Windows updates installed.
Your dealer normally installs T3RRA software. Refer to the Dealer T3RRA Install Manual. You need both the standalone T3RRA Cutta Desktop installer and the unlock code.
Updating T3RRA Software
How do you know an update is available?
At startup, the software checks for an updated version only if the computer or tablet running it has an active internet connection. With that connection, one of two messages appears briefly in the bottom left corner of the main window: either the software is up to date and no update is available, or an update is available and the message shows its version number.
How do you update?

A progress window shows the download status. When the download is complete, you will be prompted to close the software and re-open it. The upgrade is complete after you close and re-open the software.
A strong internet connection is recommended for updating.
When should you update?
Don’t fix what isn’t broken! If the software is doing everything you want, don’t tempt fate by changing anything. In particular, don’t update the software in the middle of an operation. Only update if there is a clear problem or your dealer has advised you to do so.
What should you do if updating causes more problems than it fixes?
Updates can be reverted if needed. This should not normally be necessary, and customers are not recommended to perform this process. Contact T3RRA or your dealer for information about reverting updates.
The Main Pages
Main Page
This is the first screen shown when T3RRA software opens. It also appears when you press ‘New Project’ on a Wizard page, as discussed in the Wizard section.
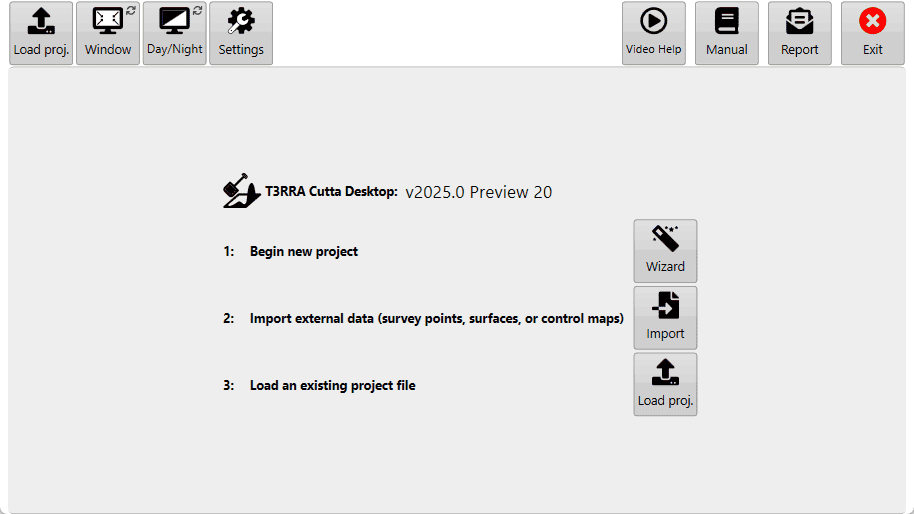
Points to note:
- The file name currently loaded will be displayed at the top of the screen if you are not using ‘Full Screen’ mode.
- The name of the software will be displayed.
- The version (v2023.2) will be displayed.
In the center
When starting T3RRA Cutta Desktop, choose one of the three central options: begin a new project with the wizard, import data directly, or load an existing project.
 Wizard — Tap to start collecting data for a new project. The wizard guides you through collecting, surfacing, design and applying the new design.
 Import — Tap to import external data from sources such as CSV or LandXML files, or John Deere Ops Center. See the Import page for more information.
 Load proj. — Tap to reopen a saved T3RRA project (*.TCI) and continue where you left off. See Loading Projects for more information.
Along the top
 Window — Switch between full screen and windowed modes. Windowed mode lets you view other pages on the tablet or computer while using T3RRA software. With a keyboard attached, F11 is the shortcut.
 Day, Night, & High Contrast modes — Choose a color scheme for the software.
- Day mode (1): Classic white (the mode used in the manual).
- High Contrast (2): Is an inverted version of classic white.
- Night mode (3): Has a black background and a green foreground.
For a YouTube video tutorial on contrast adjustment visit https://youtu.be/b-YLq5bELTk or use your phone to scan this barcode

 Settings — Once T3RRA software starts, first confirm that its configuration is correct. The next section explains the settings and how they operate; see the Settings article for more information.
 Manual — Press ‘Open Manual’ to download a digital copy of the manual and install it on your device. Once downloaded, the same button opens the manual.
 Report — Open the bug report/feature request window to report issues to T3RRA. The name and email address are filled automatically from the details linked to the software licence. An internet connection is required.
For a YouTube video tutorial on sending reports visit https://youtu.be/YzdzwxzxydU or use your phone to scan this barcode.

Settings
 Settings is available at the top of the screen when you are not viewing a map or exporting. Use it to control T3RRA Cutta Desktop options such as map appearance, units and button size.
Application Tab

‘Language’ – Changes the language
‘Length’ - Changes unit of distance measurement.
‘Area’ - Changes unit of area measurement.
‘Volume’ - Changes unit of volume measurement.
‘Estimated Cost’ — Set the estimated cost per volume of dirt moved. Click the button on the right to customize the currency format. Enter text before and/or after the amount, such as a currency code or other information; an example appears on the right.

‘Surface Grid’ — Choose whether grid lines appear on the map. By default, the grid sizes itself to fit the field. The grid dimensions appear in the lower right corner of the scanned area.

‘Lock grid size to’ — Set the grid size manually, or leave this empty for automatic sizing.
‘Cut/Fill Color Style’ — Choose Magenta/Green (Magenta for cuts, Green for fills) or Red/Green/Blue (Red for cuts, Green for neutral, Blue for fills).
‘Surface Color Style (Low,High)’ — Choose the colors representing surface lows and highs from the drop down menu.
‘Slope Display’ — Display slope as a Percentage or a Ratio: 0.1% or 1/1000.
‘Show screen keyboard’ — Choose whether the keyboard opens automatically when needed.
'Show Project Swapper button'- Shows the project swapper icon.
‘Estimated Cost’ — Cost per cubic meter or cubic yard is calculated for cuts only. Currency is based on the current language.
'Download Updates' — Choose to update to the latest version when connected to the internet.
'Show update log' — View software update details.
For a youtube video tutorial on grid size override visit https://youtu.be/9rlCn1VuGlo or use your phone to scan this barcode

Project Tab

Changes in the Project tab are not represented in a project that is already open when you change the settings.
Surface Pixel Size — The default of 2 meters (~6 feet) is adequate for most purposes. Consider 1 meter or 0.5 meters when creating small interval contours or improving definition on drain batters/backslopes.
A field surface is a “raster”: a grid of elevation heights. Its cells, called “pixels”, have uniform edge sizes. Smaller pixels require more cells to cover the same area and provide a more precise elevation surface.
Points of interest
-
If pixel size is too large then the field surface will not appear smooth, and short range changes in elevation may not be adequately represented.
-
If the pixel size is too small, then the computer will have to work harder to process the data. Dividing the pixel size by two increases the amount of pixels by four.
Advanced Settings Tab

‘Enable diagnostic data’ — Keeping this enabled is highly recommended. The collected data helps us assist you if issues occur.
‘Open Task Manager’ — Open the computer's task manager tool to display all systems currently running on the computer.
‘Explore error logs area’ — Open the folder on the tablet containing all error log files. If you encounter an issue, we recommend sending us the latest file so we can identify and correct the cause quickly.
‘Version Manager’
Use Version Manager to revert to a previous version.
‘Reset to Default’ — Reset all settings to Default.
‘Automatic backup frequency’ — Choose how often T3RRA Software backs up your work from the drop down menu:
- Never — No backup save.
- Low — Backup save every 20 min.
- Medium — Backup save every 5 min.
- High — Backup save every 2 min.
‘Terrain model Quality’ — High is the default. This setting is most visible on surfaces in 3D. Lowering it may smooth out displayed details and depressions; they remain in the surface but are not represented in the 3D display.
‘Map update rate’ — Change how often the map updates during Surveying and Implementation.
New Project Options


Collect elevation data and process it into a control map. This is the usual starting point for a new job.

Use an elevation data file supplied by an external source. Various file formats are supported.

Load an existing T3RRA control file from disk or the cloud.
Save Project
Saving a project lets you return to it later and keeps a copy of your data in case of accidents. We STRONGLY recommend saving projects periodically to guard against data loss.

The Save project button is in the top left corner of any main wizard page.
Structured saving
The Save proj. button opens the screen shown below for saving a project in T3RRA’s structured file saving area.

Enter values for the following fields:
- Grower
- Farm Name
- Field Name
- Project Name
Alternatively, select a previously saved value from the drop down list in any of these fields.
Press the final Ok to save the project and add its file to T3RRA’s structured file saving area.
Choose another save location
Select Manually Choose Location to save to an alternate location.

When choosing a save location manually, use either of these two navigation methods:
- Use the left portion of the window to navigate through folders to the desired save location.
- Use the main section in the center of the window to navigate to the desired file save location.
NOTE: Project files are normal Windows files and can be stored anywhere on the computer. We recommend regularly copying your files to a location off the in-cab tablet, so they are stored safely if anything happens to your tablet or PC.
Autosaving
T3RRA software autosaves project data at approximately 5 minute intervals to help in the event of accidental software closure or software or hardware failure.
Autosave files use the same name and location as the open project, with the additional suffix .backup.

When you load a project, the software checks for a backup. If a backup exists and has a newer date/time stamp, you are offered the option of loading it.
An autosave file has the same format as a regular project. To keep both the original file and the autosaved version, use Windows Explorer to rename the autosave file and remove the .backup extension.
Loading Projects
Open the project selection window
Use Load proj. to load saved T3RRA projects from your tablet or external sources such as USB drives.
Press Load proj. at the top left or bottom center of the Main Page to open the project selection window shown below.

Select the project from the desired field, then press OK.
The Grower/Farm/Field file structure organizes projects. For information about these profiles and their setup, see later in this section.
Manage project files
Each file has three buttons:
 Left — rename: the pencil-and-paper button renames the file.
- Center — delete: the trash-can button removes the file and moves it to the Windows Recycling Bin.
- Right — move: the two-folder button opens the same window used to save a file in T3RRA software, allowing you to move the project to a new location.
Show all files

Choose Show all files to scan your computer’s C: drive. When the scan finishes, the list is populated with T3RRA Cutta project files.
Enter text in Search to display only projects with matching file names.

The progress bar at the lower right indicates that scanning is in progress.
When you find the desired file in the list, select it and press Ok.
Browse file location

Click Browse file location to open the selected file’s location in File Explorer.
Find a project manually
 Find manually can be used for files outside the default T3RRA folder structure. Project files are normal Windows files and can be stored anywhere on the computer.

In the file explorer, find and select the T3C project file, then press Open.
Download from JD Ops Center
 Click Download project to open the JD Ops Center browser and view projects in JD Ops Center.

Select the project and click Load project.
Check the loaded project stage
After a file has been selected and loaded, the wizard page should appear and show the project’s current stage.

Import page
Use the Import page for elevation or design data collected with an external tool. Open it from the Main Page or the wizard’s surfacing step. The page initially lists the available import types.
Do not import a TCI file. Load it instead; see Loading Projects.
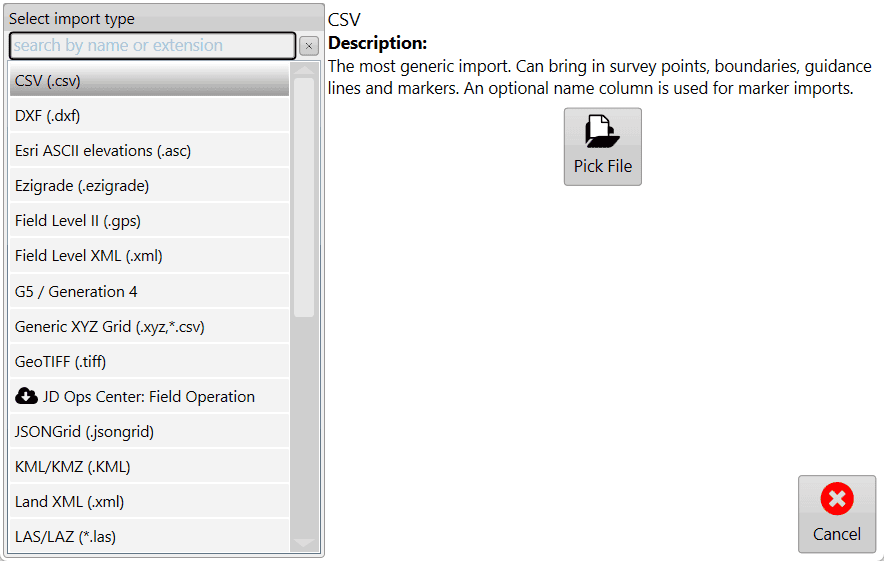
Select the import type and files
Tap the import type you need in the list, or use the text box at the top to search for it. After selecting the type, tap Pick File on the right and navigate to the file(s) you want to import.
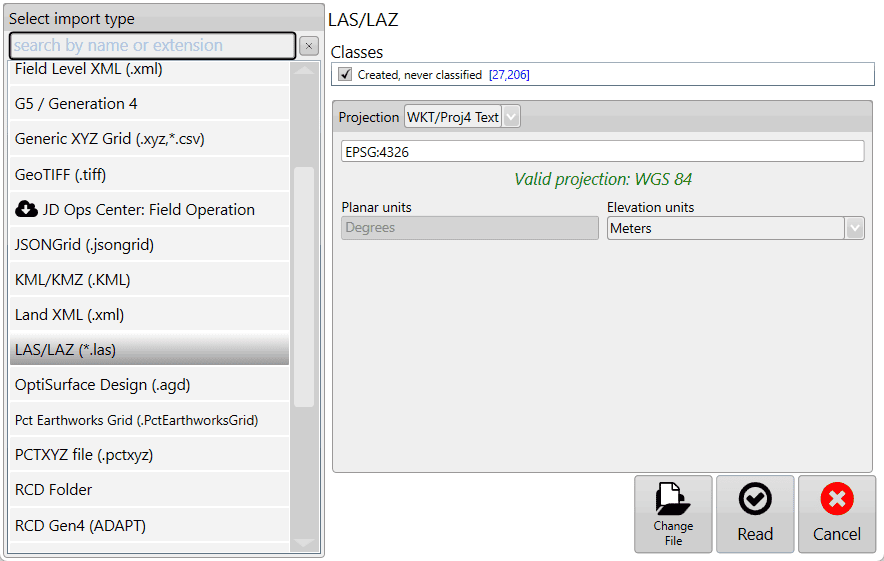
Set any required options and read the files
After you select the file(s), additional options appear if more information is required. For LAS/LAZ, these options let you filter point classifications and the projection. If you selected the wrong file, tap Change File; otherwise, tap Read to continue.
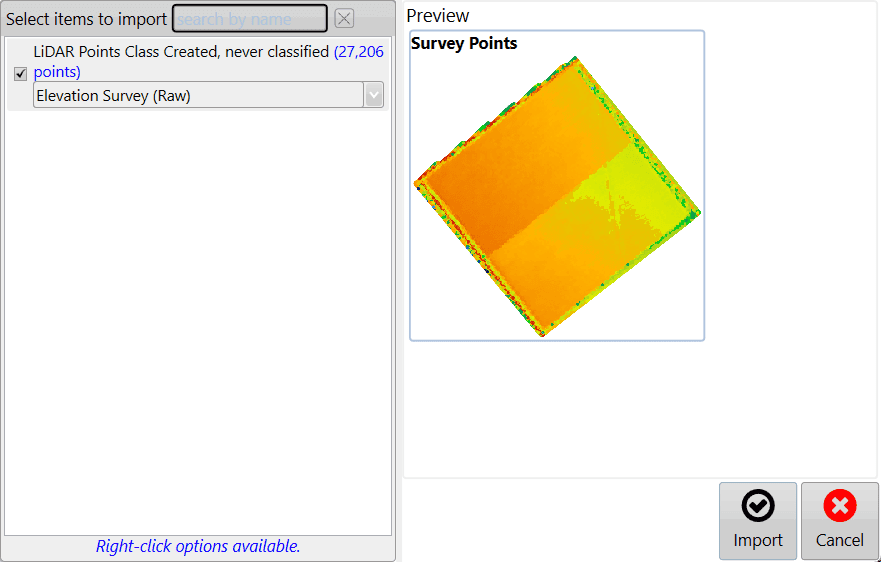
Review the contents and import
The file(s) are then read, and the contents available for import are listed. Edit the details of each item as needed:
- Mark surfaces as Elevation or Design.
- Mark points as surveys, drains, linework, markers, or boundaries.
When you are satisfied with the edits, tap Import to start working with your data.
Common tools found in the Wizard
Zoom Control

You can zoom the map using several methods.
Tablet gestures and mouse
On a tablet, use a two-finger pinch: bring your fingers together on the screen to zoom out, or move them apart to zoom in. You can also zoom with the scroll button on your mouse.
Optional zoom buttons
As an alternative, add zoom in and zoom out buttons to the bar at the top right.


Zoom to full
The Zoom to full button is independent of the other zoom controls and does not need to be enabled. Press it to zoom the map in or out to the maximum size that shows the entire surface grid.

Image Overlays

Image overlays import geo-referenced image data into a field.
Press the View button at the top of the screen to access image overlays. The overlay panel is shown below.
Image overlay controls

Load image is the primary way to add overlay images to a field. Press the button to open a file window, then select the desired file. Supported overlay file types are .KML and .TIFF.
Use Load image from JDOC to download images from the John Deere Operations Center into the image overlay. This lets you compare previous data, such as yields, with current survey data.
To delete an overlay image, uncheck the box next to it, then press Delete images. This removes the layer from the available list.
To make an overlay transparent so that layers below it can be seen, check the box to the left of the layer, then press the Transparency button on the right.
Press a layer to display it above the other layers. Drag layers to adjust their position in the image stack.
Choose Mode - 2D or 3D
Mode
2D View is the default map mode, showing a 2D aerial view.

Switch to 3D View to see the terrain as small hills and valleys.
In 3D View, press the vertical scale magnifier, shown below, to increase the exaggeration of the hills and valleys and make them easier to identify.
To change the focal point in 3D View, quickly double-tap a position.

View
A map can be displayed using a variety of viewing options.

Surface
Surface selects the source for the map’s 3D topography and coloring. There are 6 options:

Elevation shows the original surface before any dirt is moved. The map uses a Red to Blue gradient: Red indicates low areas and Blue indicates high areas.
Design shows the applied design—the surface you are trying to reach at the end of the dirt-moving process. It uses the same color scheme as Elevation.

Both the Elevation and Design surfaces determine the legend range.
Cut/Fill shows where the design will take dirt from and where it will put dirt. The layer’s coloring depends on the current Cut/Fill color scheme in Settings > Application.

The Cut/Fill legend shows a histogram.
Satellite image toggles the satellite image background on and off. The eye changes the visibility of the image to link to google earth.
Layers
Turn defined layers on or off here, including the current surface (see above), depressions, drains, linework and loaded overlays such as KML. Use the buttons at the top to load and clear layers. Click the transparency toggle button beside a layer to change its transparency.

NOTE: The depressions layer is not shown if the project has only drains and no elevation surface.
Markers
Markers identify points of interest at user-selected locations on a design. A marker can also serve as a benchmark “control point”. To use a marker as a Benchmark location, refer to Set Zero using a marker in this manual’s Implementation section.
Set marker

Use Set marker to place a marker on the map. Markers are always placed at the current location.

Creating a new marker opens a window where you can enter its name.
Edit Marker
Edit Marker opens a window where you can select and edit any marker on the map.

The Edit Marker button opens the window shown below. It displays each placed marker’s heading, distance and height relative to your current position.

Screenshot
The small camera button is at the top right of any mapping window. Press it to capture a screenshot of the current screen.
After the screenshot is taken, the pop-up shown below appears. Press Yes to open the folder where the screenshot is saved. For more information, see the Screenshots tutorial on YouTube.

Battery Level

The Battery level indicator is at the top right of the screen, next to the screenshot button.
It shows the tablet or computer's battery level and whether it is plugged into power.
Google Earth

Google Earth captures the current display area and overlays it on a satellite image of the field location. For more information, watch the Google Earth YouTube video.
You must have Google Earth Pro installed on your computer for this to work.
Surfacing
Setting the Search Radius manually
If the automatically generated search radius does not give the expected result, you can adjust it manually in the bottom left corner of the surfacing page. Consider the following when making an adjustment.
What the Search radius means
A Search radius is required to convert discrete elevation points into a continuous surface. At locations that were not directly measured, elevation is estimated from surrounding measured points. The search radius determines how far the surfacing algorithm looks for those points.

Effects of changing the radius
A search radius smaller than required leaves gaps in the surface. A radius larger than required normally has no visible effect on the resulting surface, but surfacing takes longer to complete.
In some cases, surface artifacts bridge sections of the field where you would not expect a surface, such as a pond or the inside corner of an L-shaped field. Choosing a smaller search radius can sometimes remove these areas. Their effect is normally limited, but they can affect your area and dirt volume records.
General sizing guidance
In general, use a search radius of about 2 times the swath width at which the data was collected. This sizing should keep the time needed to apply the surface short while using as much data as possible to generate a representative map.
Inline Offsets
Inline Offset, also known as Fix Lag, is a surfacing tool for correcting elevation data imported from other sources.
Open Inline Offset
Press Fix Lag at the left end of the tools at the bottom of the screen. This opens a pop-up window with options for correcting elevation alignment.

Video tutorial
For a YouTube tutorial on Inline Offset, visit https://youtu.be/O9Sgkx-DffM or scan this barcode with your phone.

Correct elevation alignment
As you correct elevation data in the pop-up window, the correction is shown on the data behind the window. Two separate sections in the pop-up control the correction.

Shift distance
Move the slider to control how far the data is shifted, or tap the text box in Shift distance to enter the distance manually. Both the slider and the manual Shift distance value have a maximum of 100ft (30m).
Pass separation
The lower portion of the window controls pass separation: the distance required between any point and the next point along before it is considered a new segment.
Check before accepting
Changes made in the Inline Offset window are reflected on the surface on the map. Check that your change has the desired effect before accepting.
Surfacing a survey also creates a design
Surfacing collected survey points creates a terrain model of the field’s original elevation. T3RRA also automatically creates a design surface that is an exact duplicate of this original elevation surface.
This duplicate provides a base layer to work from: T3RRA allows design surfaces in separate regions of a field, as well as design surfaces based on existing design surfaces.
Because a design surface is created automatically, you can go straight to implementation after surfacing even if you have not specifically created a design. Surfacing is normally automatic, so you can usually go directly from collecting to implementing. A design surface does exist, but it duplicates the original elevation surface, so the cut/fill map contains 0 values across the whole field.
Editing Survey Points
During surfacing, you can edit or remove survey and drain points using the selection methods below.
Select points
Select by Z
Use Select by Z to select elevation points by height.
- Click Select by Z to display a graph of all your elevation data.
- Click the two dashed lines and use them to wrap the data at the height you want to select.
- Click Apply. The selection appears on the map in black.

Select by lasso
Use Select by lasso for a freeform selection.
- Press down on the map and drag your finger around the data you want to edit. A blue dotted line shows what you are about to select.
- Release your finger to select the data.

Select by circle
 Select by circle selects everything within the circumference of the circle you draw.
- Press down at the center of the circle and drag outwards. A blue dotted line shows what you are about to select.
- Release your finger to select the data.
Select by path
Select by path will delete all consecutive points between point A and point B.
- Press down at the point where you want to start and drag to an end point.
- All points collected on that path between the two points will be selected when you release your finger.

Active selection and cancellation

While these selection functions are in use, their buttons display large red circles, indicating that deleting is active. Press the buttons to cancel selection and avoid accidentally selecting data while moving the screen or zooming.
After making a selection, you have two options: delete the points or change their height.
Deleting Survey/Drain Points
 Click the Delete button that appears after you select points. The selected points are deleted immediately. Because this change is permanent, saving before you do this is recommended.
Changing height of Survey/Drain Points
Because this change is permanent, saving before you do this is recommended.
- Click Modify Elevation to open the screen shown below.
- Enter the amount to change the elevation by and click Apply.
- Your data is updated immediately, and the change is visible on screen.

Video tutorial
For a YouTube tutorial on editing points, visit https://youtu.be/Q0581DSU7j4 or scan this barcode with your phone.

Common Design Tools
Regions in T3CD
Create workable regions
Press Regions to divide a field into multiple workable areas. Regions are not available in drain-related functions. Each region can use different design options, such as different primary and secondary slopes or different levee designs.

NOTE: Different regions can use different design types: for example, a best-fit plane in one region and a multi-fit surface in another.

Split regions
- Position the splitting line across two edges of an existing region, or across the whole field if no regions exist. Move Point A and Point B directly with the touchscreen or mouse.
- The split line is straight. To create a multi-segment split, tap and drag the white nodes.
- You can split multiple times, then merge regions to build complex region shapes.

In the Circle Guide and Levee design tools, region splits use circles/levees instead of a line. These allow custom splits for pivot irrigation fields and rounded corners.
Merge, hide and restore regions
You can merge regions that are far apart. If one region contains two separate areas, position the split line between the two parts and press Split to separate them.
Apply a design
When you have finished adding regions, press Design.

In multi-fit, best-fit, smoothing and levees, use the drop-down menu to select a region. Design changes then apply only to the selected region.
Choose whether to apply your design to the original elevation surface or to the design surface.

Rainfall Simulator

The T3RRA product suite includes a rainfall simulation tool for visual analysis of how a field surface affects water runoff and ponding.
Two purposes for rainfall simulation
First use the simulator after surveying the field and before placing any design on it.
- Verify the surveyed surface. Someone familiar with the field can usually judge whether the simulated water flow matches its normal runoff pattern. A familiar pattern gives the operator confidence that the survey has produced an accurate field model. If the results are unexpected, critically revisit the survey and consider collecting more data.
- Compare the design with the original surface. A design is expected to change the drainage pattern. Analyse the designed surface to see whether it will have the expected effect on drainage.

Interpreting timing comparisons
The rainfall simulator cannot tell you how long a field will take to drain. Soil type, soil moisture level and soil depth before reaching hardpan are among the many variables involved. Calculating drainage time is beyond the scope of this software.
To get an indication of how much faster one design may be than another, compare their iteration counter values at the same drainage %. The simulation's timing information is qualitative, not quantitative.
Comparing surfaces and views
Switch between the design and original surfaces to compare changes in water flow only when the water simulation is stopped.
Use Stop at counter to compare the water remaining on the design and original surfaces at the same specific counter value.
View the water simulation in 2D or 3D, just as you normally view elevation and design surfaces.
Video tutorial
Watch the rainfall simulator tutorial at https://youtu.be/LJ5Vw9Q7tqA, or scan this barcode with your phone.

Earthworks Information
Note: click within the Info text box to expand the view to full screen.
Each region has its own earthworks details and cut/fill summary.
Press Records, shown as a printer, to save design details as a PDF to a folder for record keeping and documentation.
Press Activity Log, shown as a clipboard, to view a file's activity, including file save times and when and what design functions were applied.
Note: the KMZ and Upload to John Deere buttons were formerly on this screen. They have moved to the Export step.
For the Earthwork information video tutorial, visit https://youtu.be/U0RB2av-vow or scan this barcode with your phone.


Notes on printing records
The Records feature in T3RRA creates a PDF document and saves it to the hard drive. It provides an overview of the operation being performed and is suitable for record keeping or supplying to field managers or clients.
The PDF includes:
- Map of the original surface
- Map of the design surface
- Map of Cut and Fill areas
- Statistics relating to the earthworks
The report maps include a grid overlay showing data values.


Notes on the Activity Log
The Activity Log records user actions in a project, keeping a sequential history of design actions. It helps explain the methods used to get from the original design surface to the final design surface. Where possible, it records slopes, directions and the design tools used. Designs can be applied to existing designs and differently in different regions, so the sequence from the original surface to the final design surface can be complicated.
The Activity Log also records the results of each design action as the resulting dirt balance statistics.
Refer back to the log if you are unsure about the steps taken or parameters used. Each log entry includes a date and time to clarify when the action was performed.
Use the log to compare two or more design options. The results of each design operation are kept there, making them easier to compare without remembering them or writing them down.

To save or email the log, use Copy to copy it to the clipboard. Then paste it into another application.
Calculator

A calculator is available in some tools that require you to enter a value.
The calculator helps reduce the stress of creating field and drain designs.
As well as performing calculations, the calculator lets you add quick values.
Quick values are useful when you do not need an exact value and want to get moving as quickly as possible.


Full Field Design tools
Design Functions

Best-fit
Best-fit calculates the slope and direction of a single plane that best fits a field or region while minimizing the dirt moved.

Multi-fit
Multi-fit builds multiple smaller planes that follow the ground contours to drain water in a single direction, usually along irrigation and/or wheel tracks. The minimum and maximum slopes influence each plane’s design to improve field drainage while moving as little soil as possible by staying truer to the existing elevation gradients.

Smooth
Smooth smooths out gradients on a surface, with adjustable strength to control the smoothing effect. Region blending lets you set a slope between regions on the field for a smooth transition.

Offset
Offset adjusts a surface’s elevation up or down in relation to importing and exporting dirt volumes. For example, an inch of imported topsoil can be spread evenly over an entire region or field.
AB Profile Tool

In the Design step of T3RRA Cutta Desktop, use the AB Profile Tool to draw an AB line anywhere on the surface and view the side profile of the elevation between its two nodes. Open the tool with the icon shown above, located in the bottom left corner of the map. The square node is the anchor and point A; it represents the left-hand side of the graph. Move the round node to extend the line and set point B, which represents the far right of the graph. Use this profile to visualise the slope anywhere on the surface.


Watch the AB Profile Tool tutorial.
Best-fit Design
Best-fit calculates the slope and direction of a single plane that best fits a field or region while minimizing the dirt moved.
The plane most accurately fits the existing topography and minimizes dirt movement for creating a single plane. This can still mean moving large amounts of dirt.
Tip: Divide the field into regions and fit a single plane to each region to help reduce dirt volumes.
Enter the design details to create a plane, or have the T3RRA software calculate them automatically.

Setting slope parameters
The software attempts to find the most appropriate line of best fit. You can also set the primary and secondary slopes manually.
Manual settings are recommended only for users with a good understanding of Laser Plane systems.
To set the primary slope direction manually, select the checkbox labeled Manually set primary slope direction.
When in doubt, consult an irrigation engineer.
Cut/fill ratio, Max cut depth, and Import
These settings are available in two locations. Defaults applied to new projects can be set in the Project tab of settings (see section B), or in the lower left corner of the Best-Fit (and Multi-Fit) page.

The Cut/fill ratio depends on soil characteristics: the material being moved and how much it will “settle” or “shrink” when compacted.
Enter Max cut as the maximum allowed cut depth. If any points on the map exceed this depth, the warning shown below appears. Adjustments may be required.

Use Import to bring dirt in from a stockpile or export dirt from the field to another area. Enter a negative value for exporting.
Multi-fit Design
Select Multi-fit to create an optimized non-linear surface whose slopes stay between the minimum and maximum you enter. Multi-fit balances dirt down the field in your specified direction, within strips. This suits working within rows while moving minimal dirt.
By allowing slopes to vary within set tolerances, a Multi-Fit design can greatly reduce the amount of dirt moved.
Dividing the field into regions can reduce dirt movement further. To generate a Multi-fit plane, enter the details in the panel shown below and fill in all fields.
NOTE: Leaving either min% or max% blank will produce undesirable design results.

Set slope range
Find the average slope percentage with the iGrade™ Plane Calculator. Alternatively, in T3RRA Cutta, create a plane of best fit in a direction, then check the primary and cross slopes in the plane statistics window. If in doubt, consult an irrigation engineer.
Perform cross-strip optimization
This option attempts to tilt the strip sections to match the actual side slope. Use it in fields with high side slopes (>2% slope); it is unlikely to benefit relatively flat fields. It is enabled by default.
Perform preliminary side slope adjustment
This option makes an initial side slope adjustment, attempting to keep the side slope no greater than the minimum row slope. Use it if water might tend to run across rows rather than down them.
Material and cut settings
You can set Cut/fill ratio, Max cut depth and Import in two locations: the Project tab of settings (see section B), where you set defaults for new projects, or the lower-left corner of the Multi-Fit (and Best-Fit) page.

The Cut/fill ratio depends on the material being moved and the percentage that will “settle” or “shrink” after compaction.
Enter the maximum permitted cut depth in Max cut depth. If any points on the map exceed this depth, the warning shown below appears. Adjustments may be required.
Use Import to bring dirt in from a stockpile or export dirt from the field to another area. Enter a negative value for exporting.
Smooth Design

Select the Smooth button to create a more regular surface with fewer, more gradual ridges and dips. Adjust the smoothing strength as needed for a stronger or lesser effect.
Before

After

Regular Smoothing
Regular smoothing removes bumps and dips from the field surface by applying an averaging filter. 
Use the Smoothing strength slider to control the smoothing effect. Increasing the slider value increases the radius used in calculations; smaller values have less effect.
Apply smoothing to the whole field or to individual regions, using either the original surface or an existing design.
Directional Smoothing
The Directional smooth checkbox is just below regular smoothing.
Directional smoothing produces a stronger smoothing effect in one direction and a weaker effect in the perpendicular direction.
In the provided text box, enter the primary smoothing direction.
Set the influence radius along the primary direction with Smoothing strength in the primary direction.
Use Smoothing strength in the secondary direction to control the influence radius at a 90 degree angle to the primary direction.

Region Blending
Region blending “feathers” the edges of regions to create smooth transitions between them.
Use Max Allowable slope to set the maximum steepness allowed for a region blend.
Distance from Region line limits how far the blend can extend into each region, helping to avoid affecting other design elements.
Note: Region-blending changes may not be obvious in 2D view, but can be much more prominent in 3D view or the cut/fill map.
After entering the parameters, press Apply to see their effects.
Before

After

Offset Design
Select Offset to raise or lower the surface height of a field or region.

Offset can help with:
-
Importing and exporting dirt
-
Addition or removal of topsoil
-
Raising pads


Choose either of these ways to set the offset amount:
-
Enter the desired offset amount manually, or adjust it in set increments with the up and down arrows.
-
Use the calculator to help set the offset amount when offsetting the surface by a certain volume of imported or exported dirt.
-
Formular
Left over volume = (Cut/Fill ratio * Volumn of cut) + Volume of fill.
Result = (Import + Left over volume) / Selected area
-
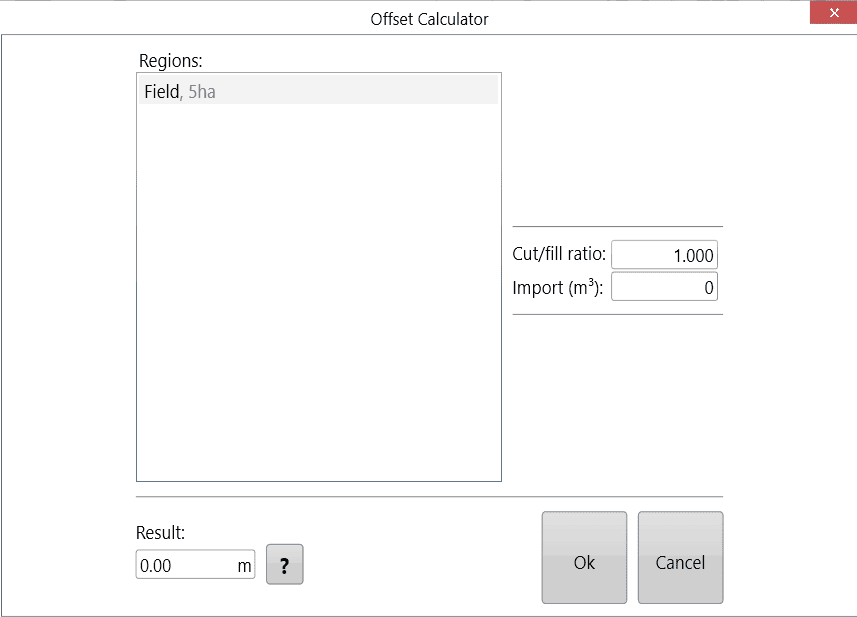
Negative import values are treated as exports.
After entering the parameters, press Apply, shown as the offset design icon.
When you are happy with the design, follow the steps in the completing your design section.
Drain Design Tools
When designing drains, there are several aspects that you will find that are across all the different Drain Design tools.
The most important feature of the drain design tools that you will find will be the cross section found at the bottom of the screen. The cross section displays all the ups and downs along the drain surface.
The cross section is made up of three different lines. The Red line is the proposed design that you are currently working on. The Blue line is the existing surface that has been surveyed. The Yellow dotted line is the current design surface, when starting a new design this will be overlapped with the Blue line and when a design is applied it will overlap with the Red line UNLESS a second design is being made on top of that.
Auto-Drains Design

Auto-Drains automatically generates drain paths for wet areas in your field, calculating optimal ditch lines to drain depressions.
Auto-Drains has two tabs:
- Create controls the parameters that must be met before drains are applied to the surface.
- Edit Drains lets you edit drain paths.
Create

Edit

Create Drains
Line smoothing strength controls sharp turns and the smoothness of drain lines. Move the slider farther right to make the lines rounder, with fewer sharp turns.
Surface smooth strength applies an averaging filter to the field surface to remove bumps and dips without creating a full field earthwork design.
Min. drain length sets the minimum length a drain must have to be displayed on the surface.
Min. depression area sets the minimum surface area a depression must cover before T3RRA software will consider draining it.
Min. depression volume sets the minimum volume a depression must have before a drain is implemented.
Press Add Stop Line to create a black line with large red anchors at each end. Drain lines will not cross this line.
To confirm placement, press Lock Stop Lines, which appears next to Add Stop Line.
Press the white anchor in the center of the lines to create another red anchor so the lines can be adjusted. To add more stop lines, press Add Stop Line again.

A depression is drained only if it meets all minimum length, area, and volume criteria.
Edit Drains
The Existing Drains list contains every drain in the current project.

Select, delete and move drains
- Tap a drain in the list to select it; tap again to unselect it. You can select multiple drains.
- Delete removes all selected drains. Delete All removes every drain in the list, including unselected drains.
- Choose Move Lines to change all drain lines on the surface, as illustrated below. Blue dots along the lines identify points you can move to adjust the path.
- Start at the origin point, which can also be moved, and work downhill.
- Move the points to adjust the path. The lines automatically adjust to your changes so that they flow off the edge of the surface.
- Choose Save Changes to keep the changes, or Discard Changes to restore the original paths.

NOTE: If you adjust a drain line, then make a second adjustment closer to the origin point, the first adjustment reverts to the line’s original state. Auto-drains ALWAYS flow downhill from the point of the last change.
When the drain paths are satisfactory, return to the wizard page. Use Drain Design to set the profiles and cross sections.
Pattern Drain Design
Use this design tool to design many parallel drains at the same time.


Select specific drains in the pattern drain window when you want to delete them.
Delete removes the selected drains; Clear All removes all pattern drains.
Set drain parameters
Set Drain length in the window, or move the red circle on the design map to set it.
Drain Heading specifies the direction in which the drains run, in degrees.
Locked: Drain Heading and Offset Direction are linked. Adjust either one and the other changes to match.
Unlocked: Set Drain Heading and Offset Direction independently.
Offset Direction specifies the direction in which drain copies are created from the original.
Drain Count sets how many drain copies to add. It does not include the original drain.
Drain Offset (Parallel) sets the distance between the lines of the copies. If the padlock is unlocked, this will not appear in the example until it is manually updated.
Drain Offset (Origin) sets the distance between the origin points of the copies.
Apply and design the profiles
After entering the parameters, press Apply, shown as the pattern drain icon.
When the paths are satisfactory, use Drain Design to design the drains’ profile and cross section.
Manual Drains

Place a manual drain
On a full field elevation surface, place the drain line along the path you want. Tap a white node to create more purple nodes for a nonlinear drain line. For reference, the purple nodes’ elevation height values are shown in the Design parameters.
- Press Apply to create the drain path.
- Delete drains individually, or use Delete All.
- Choose Edit to relocate the drain path.

Drain Design

Prepare the drain paths
Create drain paths in any of these ways:
- Survey paths in the Collection wizard step.
- Import paths.
- Use the Auto drains tool.
- Use the Pattern drains tool.
Drain Design lets you choose the slope profile and cross section before “burning” (embedding) drains into the map for implementation.

Note: When both a surface and a drain exist, design the surface first, then the drain. To edit drain elevation data, return to the Collect wizard step and edit the drain line. Doing so loses the current project designs.
Select a drain to display its depth/elevation profile in the bottom-right plot; you may need to drag the chart up into view. Use AB Reverse so the drain falls from left to right in the profile chart. This makes the slope values positive and adjustments easier.
A negative backslope inverts the drain design, turning a drain path into a road.

Note: Positioning and laying out drain paths is not part of Drain Design. Adjust driven drains in the surfacing step, or adjust paths in auto drains/pattern drains.
Choose a fit mode
The three modes for applying drain designs and adjusting the drain path are Linear fit, Best fit and Multi fit.
Linear fit
Linear fit creates one straight plane along the drain path.
Slope sets the installation gradient so water flows in the intended direction.
Offset moves the drain vertically. A positive value raises it, producing fill along the entire drain. A negative value lowers the design height, producing a deeper cut drain.

Best fit
Best fit adjusts the slope to try to follow the field's natural curve, similarly to multi-fit field design. The source also states: “Cutta Ditch”.
Note: Best-fit in drains is equivalent to Multi-fit in full field design. The naming incongruity comes from an attempt to match the John Deere SWP+ naming conventions. SWP+ is superseded by T3RRA Cutta and T3RRA Ditch.
Min. Slope is the lowest acceptable drain slope gradient.
Max. Slope is the highest acceptable drain slope gradient.
Min. Cut ensures that the design consistently cuts at least the specified amount.
Max. Cut limits the depth of the design cut so it never exceeds the specified maximum.

Multi fit
Multi fit uses both cut and fill to remove problem points of erosion and build-up. It is best suited to maintaining existing drains.
Min. Slope sets the minimum allowable slope gradient.
Max. Slope sets the maximum allowable slope gradient.
Start Elevation is the desired elevation at the beginning of the design (point A). Set it to be greater than, equal to, or less than the set value. The source describes this as adjusting the start elevation to be “no higher or lower than the set value”.
End Elevation is the desired elevation at the final design point (point B). Set it to be greater than, equal to, or less than the set value. The source describes this as ensuring the final elevation is “not higher or lower than the set value”.
Note: Multi fit tries to balance cuts and fills using the start and end elevations. If the design parameters cannot work, the message is “Model is too constrained”.

General settings
The general settings are available in all drain design modes.
For the definition of Cut/Fill ratio, refer to the appendix. The following settings and buttons are the same in all three Drain Design modes.

Copy To All copies the selected drain's settings to every other drain in the project. Use it to save time when drains need similar parameters.
Backslope (batter) is the gradient of the drain walls. Higher values produce a sharper drop into the drain. Leave the Backslope box unchecked if no backslope is wanted. Enter a negative value to make a road.
Symmetric mirrors the batter design when checked. When unchecked, the batter slope on each side can be adjusted independently.
Lock Backslope is mainly intended for drain lines, not full surfaces. It ignores the surface and creates backslopes to their maximum extent. The drain bottom is always burnt in regardless of surface elevation: for example, offsetting a drain up 5m still burns in a drain bottom whether Lock Backslope is on or off.
Drain Width sets the width of the drain bottom, which is always horizontal. For a defined non-zero bottom cross slope, manually set the implement's cross slope control during the Implementation stage.
Cut/fill ratio compensates for soil compaction characteristics.
Apply All applies every drain in the field, rather than only the selected drain.
Choose on elevation or on design to select the elevation profile used to calculate the designed surface. For example, if one drain needs a different design, first apply the design on elevation to All. Then select that drain from the drop down and apply its different design on design to that drain alone.
Note: Designing on a design continues to lower the drain surface.
Press Apply All (three cogs) to apply all drains at once.
Press Apply (one cog) to apply only the selected drain.
After editing drains in the surveying step, return to the Design wizard step to create a new drain design. If both a surface and a drain exist, design the surface first, then the drain.
Implement or export
Designing and applying a drain embeds (“burns”) it into the field surface model. You can then implement it like a normal field design. With a constant-depth drain cutting implement, you may only need the paths for guidance, not the depth profile or elevation control. In that case, you need not create a drain profile unless you want to examine the drains' effects in the rainfall simulation.
Optionally, use the wizard screen's Export button to export drain paths as an RCD folder structure (JD Guidance lines). Exported ditch track guidance lines can steer the tractor along the correct path to remove wet areas accurately and efficiently; John Deere AutoTrac™ is required.
Watch the video on Drain Design Tools.
Terrace Design
Terrace Design
Use Terraces to create Guidance curves that mark erosion-control terraces.

Start a terrace set
Opening the terraces tool displays a start line on the map. Terraces begin at this line; use the following parameters to lay them out.
Grade and direction
- Bank grade sets the terrace slope and therefore affects the speed of water flowing down each terrace.
- Direction sets whether terraces flow left, right, or both left and right from the start line. To make them flow towards the start line, change the bank grade to a negative value, for example from 0.2% to -0.2%.
Spacing and individual terraces
- Spacing sets the basis for terrace starting positions: Vertical distance is the elevation drop; Horizontal distance is the distance travelled along the start line.
- Use Add Terrace at the lower right of the design pane to add a terrace. Each addition updates the Next distance on the right.
- The centre list shows every added terrace and how far it extends. Use this list to change a terrace's start distance or delete it.
Smoothing and stop lines
The Smoothness slider reduces surface irregularities. Increase it if terrace lines are too jagged. However, higher smoothing makes terraces follow the Bank grade less closely; this can cause wet spots and/or require earth moving to ensure drainage.
Add Stop Line places a black line on the map with large red circles at both ends. Move the red circles to position one or more stop lines where terrace lines should end, such as at a waterway.
Manage multiple sets
Terraces belonging to one start line form a set. After creating one set, use the smaller Plus button at the top to add another start line. You can add as many as needed. Switch start lines using the Set drop down or by tapping one of the line's purple circles on the map. To remove a start line and its entire terrace set, select it and use the delete button at the top.
Export and video
When the terrace layout is complete, you may export the terraces as guidance lines, etc.
For a demonstration, watch the video on using Terraces.
Levee Design
How to create and edit levee lines.
Levee Design
Levees creates guidance lines at set elevations. These lines are also known as contour lines, level curves or isoheights. Levees can reduce erosion and runoff and promote water capture.

Working with levees
- Add levees at set intervals.
- Smooth levees.
- Delete selected levees.
- Apply levees selectively to field regions.
- Export levees as guidance curves for John Deere AutoTrac™.
Split regions with levees
You can use levees to split regions. Use a small number of levees for splitting, as recommended. Splitting regions at levees consumes those levees. To create more levees afterwards, change the elevation or vertical interval for the best results.
Levee Creation Parameters
'Start Elevation' will be populated automatically. You can also choose the ‘Start Elevation’ by manually pressing on the ‘Start Elevation’ button and then touching the design map at the location you would like to start the levees from. Press Finish selecting to apply.

'Vertical interval' tells T3RRA Cutta and T3RRA Ditch how much elevation change from the previous levee is needed before adding another levee.
'Reverse numbering' – By default levees are numbered from highest elevation to lowest, reverse numbering switches it to count up from the lowest elevation.
'Line smooth levees' adjusts how many sharp turns and how smoothly the levee lines will be created. The further to the right the slider is the more round the lines will be (with decreased sharp turns).
'Surface smooth strength' adjusts the surface by applying an averaging filter to the surface of the field to remove bumps and dips without creating a full field earthwork design.
'Min. size' determines the minimum length a levee must be before it is included as a drivable path. Levees that are shorter than this will appear grayed out and not be available as paths.
'Delete contour lines' will bring up a window allowing you to enter the number associated with the levees you want to remove.
Like other design tools, Levees allows you to use the original elevation surface or the design surface as the basis for the calculations. It may be beneficial to perform a landforming operation on this field prior to putting in levees and then base the levees off the design surface.
Cutta Even if you are not performing a landforming operation it can sometimes be useful to perform a light smoothing design on the surface first before attempting to lay out levees (ie, to work around poor data). Be warned though - If large changes are made before creating levees, they may not work properly.
Press 'Apply' after parameters are entered. Levees can be applied to regions separately. This is great to change the spacing of levees across a field.
NOTE: Levees can be added to each region individually.
 Exporting will allow the lines to be saved in many formats, including guidance curves that can be loaded to John Deere’s guidance system.
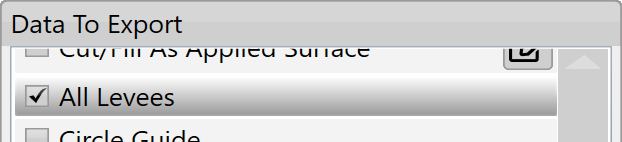
Select the Export button on the main page to start exporting levees. Then select the export type on the left. In the middle will appear list of exportable items - select 'All Levees' as shown on the right.

For a YouTube video tutorial on Levees, visit https://youtu.be/V8NLmRCQEx0 or use your phone to scan this barcode.
Analysis Tools
Overview

T3RRA Cutta Desktop offers several tools for analysis beyond what is included in our In-cab packages. These tools allow the user to further analyze and understand how their design will perform once implementation has been completed.
Circle Guide - Creates a circle for reference on the surface.
Elevation Grid - Overlays a grid with elevation values at each junction.
Flow Paths - Overlays arrows in a grid pattern that show the estimated direction of flow at each junction.
Watershed - Identifies the areas of the surface that will flow together to the same exit point on the field.
Edit Markers - allows you to view, edit, and create markers on the elevation surface.
Circle Guide

The ‘Circle guide’ tool will display the radius and total area covered by the set circle. To use the tool, drag the square center marker of the circle to the desired point or enter the coordinates. Then, click on the node at the perimeter of the circle and drag it in or out until the desired radius is achieved. Alternatively, you can enter the circle radius if it is known. Hit apply to overlay the circle outline onto the map.

Here is a video on the Circle Guide Tool.
Elevation Grid

The ‘Elevations guide’ imposes a grid design on a field in the working area and displays the elevation of points at each junction on the grid.
- ‘Grid cell size’. This option controls the size of the grid. Setting the size to 100m will result in each junction being 100 meters away from its neighbors.
- ‘Alignment angle’ is a method of rotating the grid.
- ‘Decimal places’. Sets how many decimal places will be visible on the grid values.
- ‘Show Raw Elevations’ and ‘Show offset from mean elevation’: These options will adjust what data is present on the grid.

Flow Paths

‘Flow Paths’ creates a grid on the field with arrows at each junction that point in the direction that water is expected to flow.
- ‘Grid size’. Adjusting this value will make the individual squares of the grid larger or smaller.
- ‘Alignment angle’. This option allows you to change the direction of the grid. The direction is set as the position of the yellow circle in relation to the yellow square.
- ‘Slope calculation area’. The further to the right that the slider is, the larger the area that T3RRA Cutta Desktop takes as a sample to find the water flow direction.

Here is a video on the Flow Paths Tool.
Watershed

The Watershed tool identifies the areas of the surface that will flow together to the same exit point on a field. The working area will display the surface in a patchwork of colors, these indicate your watersheds and what will flow out where. The specific colors do not matter, they are only to help identify individual watersheds.
- ‘Surface smooth strength’ provides control to adjust the level of detail on the surface.
- ‘Segmentation method’ will select a general water event to display watersheds. The options are:
- Hybrid - Immersion and Rainfall event happening simultaneously.
- Immersion - submersion of the surface by water as it engulfs the area as in a flooding event.
- Rainfall- a fall or shower of rain.

Edit Markers

'Edit Markers' allows you to view, edit, and create markers on the elevation surface. Each marker is listed by name and includes the Latitude/Longitude as well as the elevation. Markers can be moved, renamed, or deleted as desired. Additionally, coordinates and elevation can be entered manually.

Completing Your Design
Completing Your Design
Once satisfied with your design surface and/or drain.
1. Select the 'Return' button. (Top right corner)

2. Select 'Yes' to keep the design surface.

3. Select the 'Save proj.' button to save the T3RRA project.

Exporting Data
Exporting Data

Exporting allows data to be transferred to other programs. If you’re wanting to work within T3RRA, click the “Save Proj” button at the top of the screen - it is far easier to work with this format than exporting and then re-importing the data.

Steps to export data
Select the export format you want on the left.
Choose the data you wish to export. Clicking the button will allow you to change how the layer is exported (say if you wished to export a design surface as an elevation).
Provide any additional information required (such as which projection you need) and click “Export”.
Here is a video on Exporting Data.
Exporting Guidance lines from T3RRA™ and importing into AutoTrac
Remember that guidance lines are only available for Drains, Terraces, and Levees.
Should you wish to export guidance lines from T3RRA software for use with AutoTrac™ be sure to follow the following steps to be sure that the process is successful.
Exporting begins by pressing the Export button.

How to export guidance lines from T3RRA
Select the data to Export.
Select curve type.
Set the display to the model number of the John Deere display you will be using.
Input project information into client, farm, field and profile.
Press “Save” and a file with your guidance lines will be saved in the set location if you chose ‘John Deere Display Curves (RCD)’.
Press “Upload” and a file will be uploaded to JDOC where it can be assigned to equipment if you chose “John Deere Operations Center Curves (RCD)’.
How to transfer guidance lines to a John Deere display
(Instructions given are for the GS3 2630 Display, steps for other displays may vary: refer to the appropriate display manual)
Insert USB with guidance lines saved on it into John Deere Greenstar display. (The display will automatically detect the USB and display the available options.)
Select “Import Guidance Lines” which should be the bottom option.
Select the desired profile and press “Begin Transfer”.\
- On this screen select which client, farm, field and tracking option of the file you want to import and press “Accept”. (The tracking option should be set to adaptive curves.)
- Make sure the correct line/s you want to import are ticked and press “Accept”.
- A loading bar should appear, if everything has been successful the Data Transfer Complete screen should appear and you will be able to press “Accept”.
- Your guidance lines have been imported to your John Deere Greenstar display and are now ready to be used with Autotrac™.


Importing Guidance Lines from USB to a John Deere Gen4/G5 Display
How to import guidance lines from a USB drive to a John Deere Gen4/G5 Display:
- Insert the USB into the USB port on the right hand side of the cab in a Gen4/G5 CommandCenter equipped machine, or into the USB port on the display if using a Gen4/G5 Universal display.
USB Prompt will show after USB is inserted

Access USB from Main Menu > System > File Manager > Import if not prompted or if the prompt screen is closed accidentally. Hit "Next" to view File Folders

Check the box next to the folder and then hit "Next" in the bottom right corner of the display.

Make sure the boxes are checked and no unwanted data is listed. Hit "Import".

When the data imports you will see this prompt. If the import fails, format the flash drive, re-download the files, and attempt the import again.

The file is now ready to use. From the Autotrac screen, hit "Set Track".

In the Guidance Track List page, select the desired Guidance Track and hit "OK".

The Guidance track is now ready to be used.
Exporting Guidance Lines to John Deere Operations Center
If desired, you can export guidance lines straight to John Deere Operations Center where they can be organized and transferred remotely to connected machines.
Design your drains, levees, or terraces or load the project with the desired linework.

Go to the Export step.

Choose "John Deere Operations Center: Curves (RCD)", choose the linework, enter your Export Details, and select Upload. If this is the first time you have attempted to transfer files to Ops Center, you will be prompted to sign in to your MyJohnDeere account.

When prompted, choose your Ops Center organization and hit Upload.

Edit the file name if desired. This will make it easier to find in the Files page of your Ops Center account.

Once complete, you will be asked if you would like to view the exported file in Ops Center. If you would like to confirm the transfer, select Yes.

You will be directed to the Files page of your connected Ops Center account where the file containing the linework will be present.

To view the guidance lines, go to the Setup tab and select Land. From Land, you will be able to select the field you entered in the export step in T3CD. Choose the field.

You can now see the linework you designed as guidance tracks. You can now use them in Setup Files or Work Plans and send them to the appropriate connected machines to use in conjunction with T3RRA In-Cab software while implementing your design.

Exporting T3RRA Control File to JD Ops Center
Go to the Export step.
Choose "JD Ops Center: T3RRA Control File(.tci)", choose data to export and select Upload. If this is the first time you have attempted to transfer files to JD Ops Center, you will be prompted to sign in to your MyJohnDeere account.

When prompted, choose your Ops Center organization and hit Upload.
Edit the file name if desired.

If you want to remove uploaded T3RRA Control File. Select uploaded file in the list and click "Delete" button.

You can download the uploaded T3RRA Control File in Project Load window.
Hit "Load proj".

Click "Download project".

Select organization, T3RRA Control File and hit Load project.
